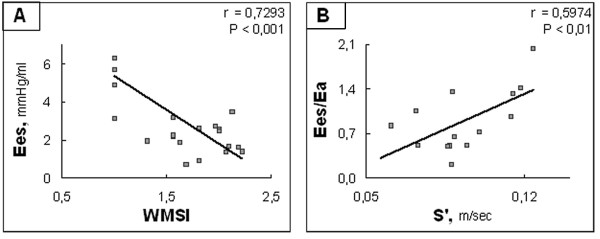
Figure 2.
Correlations between hemodynamic and echocardiographic data: systolic function. A: Scatterplot of Ees as a function of WMSI. B: Scatterplot of Ees/Ea as a function of S'. Ees: left ventricular end-systolic elastance; WMSI: wall motion score index; Ea: arterial elastance; S': Tissue Doppler mitral annulus S wave.

