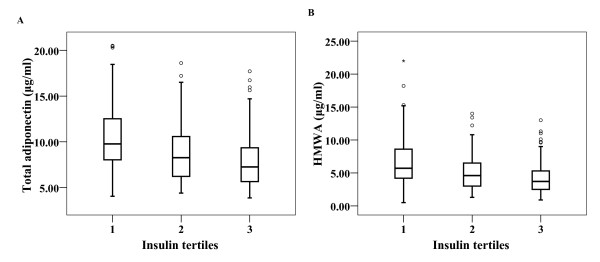
Figure 1.
Box plots of the concentrations of total and HMWA divided by insulin tertiles. A. Change in total adiponectin levels by insulin tertiles (9.77 [4.58] vs. 8.27 [4.42] vs. 7.15 [3.79] μg/ml, P < 0.001). B. Change in HMWA levels by insulin tertiles (5.7 [4.45] vs. 4.6 [3.6] vs. 3.7 [2.85] μg/ml, P < 0.001).

