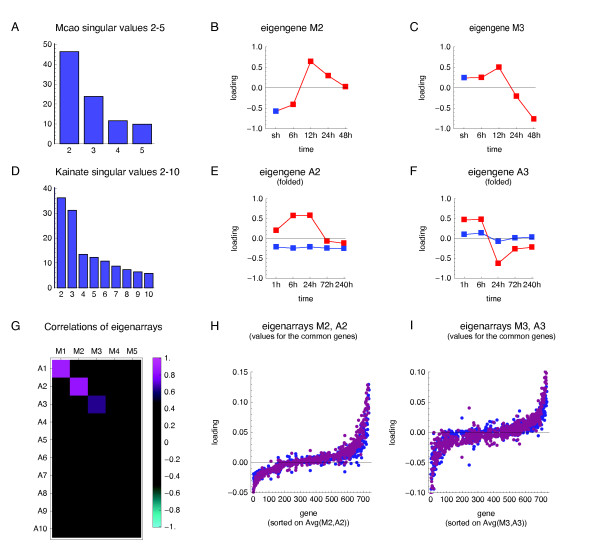
Figure 2.
Comparative SVD analysis of gene expression following ischemia and seizures. The MCAO and kainate dataset were each separately transformed by SVD and the results were compared. (A, D) The singular values plotted as bars. The large singular values for the respective first eigensystems reflecting the magnitude (constant in time) are omitted for clarity. (B-C, E-F) The two most important non-constant eigengenes in the MCAO system (M2, M3) and in the kainate system (A2, A3). Red squares indicate loadings on the conditions of treatment, blue - control. The eigengenes A2 and A3, which are vectors of length 10, have been folded in (E-F), to match the loadings onto the same time-points following the injection of kainate and saline. (G) Correlations between eigenarrays from either system for the 737 common genes. (H-I) Loadings of the respective second (H) and third (I) eigensystems, in the MCAO (blue) and kainate (violet) model, to the expression profiles of the 737 common genes. The genes were sorted on each gene's average loading of M2 and A2 (H) or of M3 and A3 (I).

