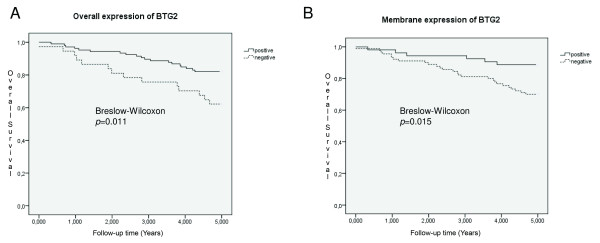
Figure 3.
Kaplan-Meier survival curves illustrating the effect of BTG2 expression. The Kaplan-Meier curves show the difference in survival between patients with tumours that revealed any BTG2 expression and patients whose tumours did not (A), as well as the difference in survival between patients with tumours that revealed cell membrane specific BTG2 expression and patients whose tumours did not (B). Solid lines represent patients whose tumours expressed BTG2 and dashed lines represent patients whose tumours did not. The p-values for the difference between the curves were calculated using a generalized Wilcoxon test.

