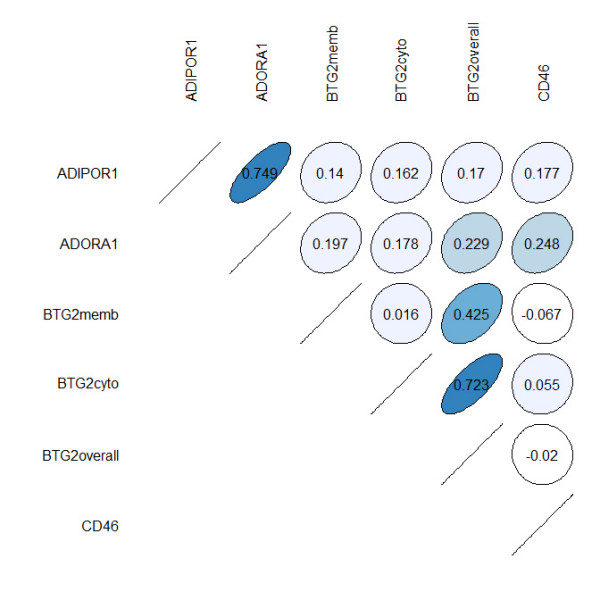
Figure 6.

Correlation plot for the expression of the analyzed proteins. The strongest correlations were found between ADIPOR1 and ADORA1, as well as BTG2 overall expression and BTG2 cytoplasm expression. The course of the circle indicates whether the correlation is positive or negative.
