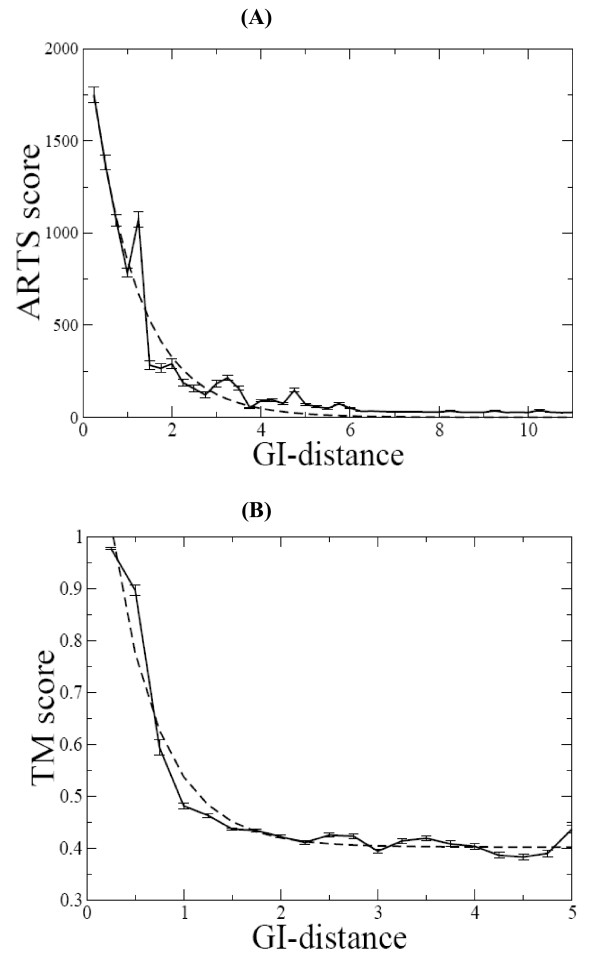
Figure 4.
Relationship between Gauss-integrals distances and ARTS and LaJolla scores. (A) Average values of the ARTS scores (with standard deviations as vertical bars) as a function of Gauss-integrals distance. The calculations were carried out on the 820,600 pairs of RNA chains. (B) Average values of the LaJolla TM scores (with standard deviations as vertical bars) as a function of Gauss-integrals distance. The calculations were carried out on the 5,050 pairs of tRNA chains. The dashed lines represent non-linear exponential curve fitting performed by GRACE program [30] with correlation coefficient -0.98.

