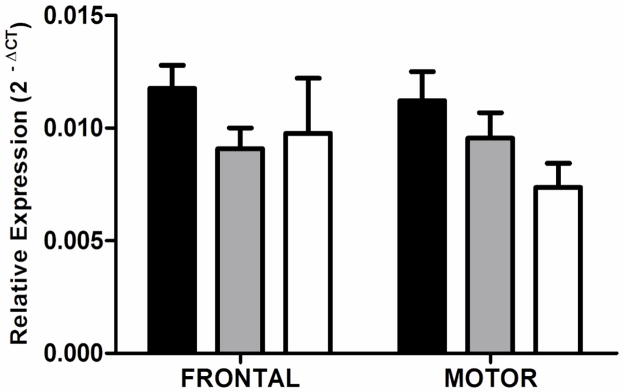
Figure 2.
RGS7 transcript expression. Expression of RGS7 in the superior frontal gyrus and sensory motor cortex of controls (black bars), non-cirrhotic alcoholics (shaded bars) and cirrhotic alcoholics (open bars). There was no significant difference in expression between groups. Mean ΔCT values were converted to 2−ΔCT values for presentation. The data presented in the graph includes cases and controls of both sexes. Error bars represent S.E.M.

