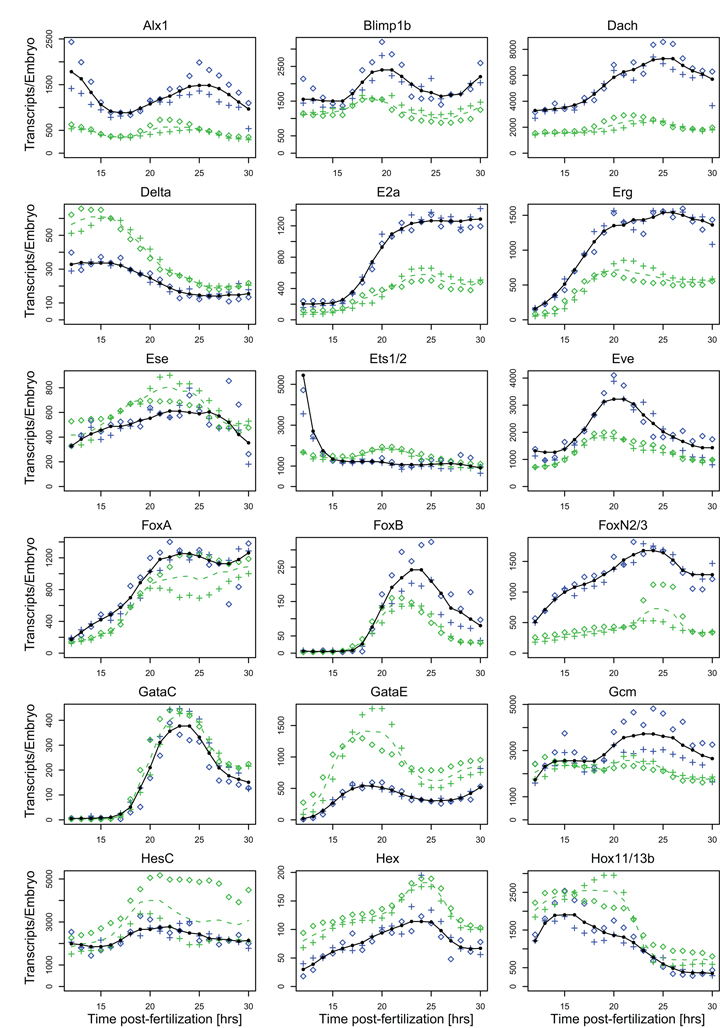
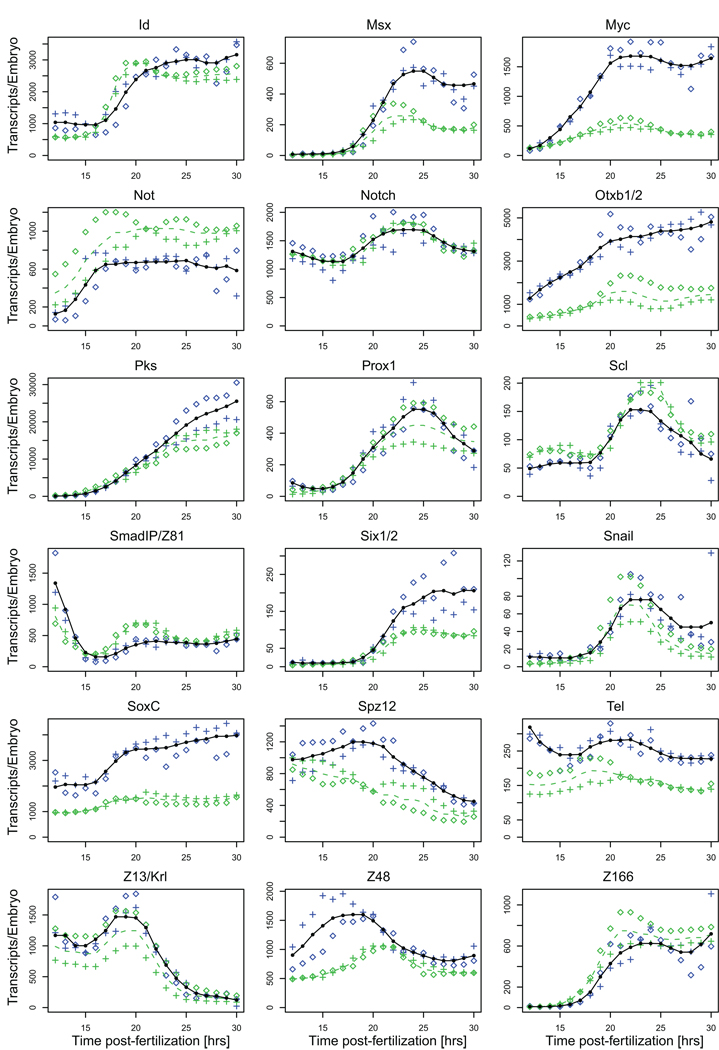
Fig. 2.
Comparison of NanoString prevalence measurements and QPCR data. The average transcript abundance as measured with the NanoString nCounter is shown in black, data for the two embryo batches as blue crosses and diamonds. Average prevalence data collected in QPCR assays are shown as dashed green lines, data for the two embryo batches used in these assays as green crosses or diamonds. Absolute transcript numbers were computed using the ubiquitin domain numbers obtained in the nCounter assays (Fig. 1).


