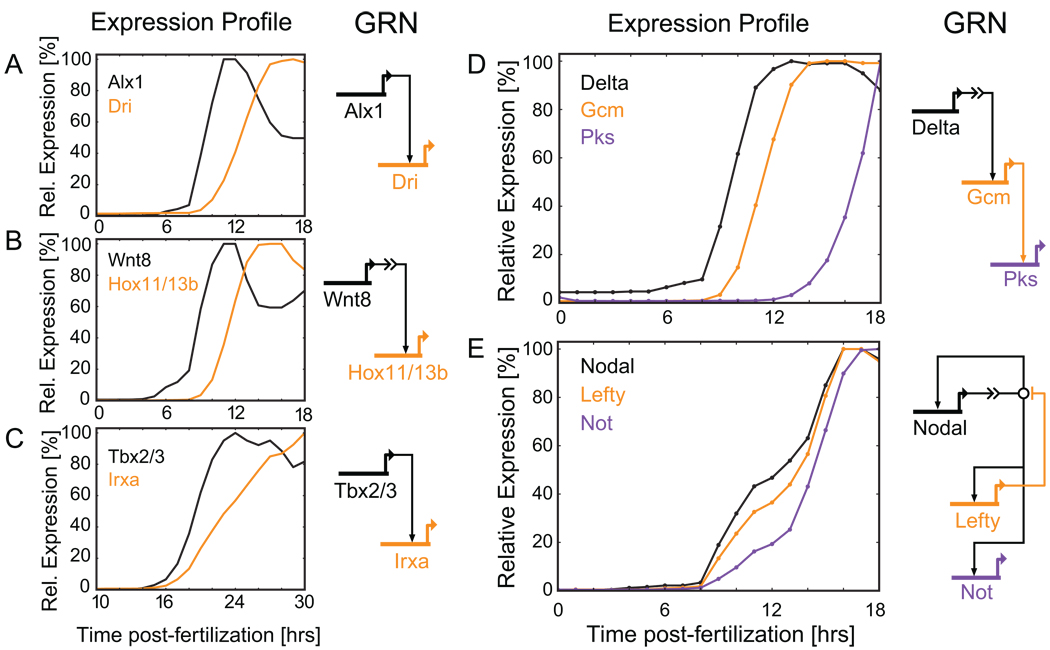
Fig. 3.
Expression dynamics of genes with close regulatory relationships. (A-C) Downstream targets often show a visible lag after their main activator first becomes transcribed. (A) Alx drives dri transcription in the skeletogenic cells of the sea urchin (Oliveri et al., 2008). (B) Wnt8 signaling leads to accumulation of Tcf1 in the nucleus of endomesodermal cells resulting in transcription of hox11 (Peter and Davidson, 2010). (C) Tbx2/3 activates irxa transcription in the aboral ectoderm of the early sea urchin embryo (Su et al., 2009). (D) Delta/Notch signaling from the skeletogenic cells activates gcm in the neighboring endomesodermal cells. Gcm in turn is a direct activator of pks (Ransick and Davidson, 2006; Calestani and Rogers, 2010). (E) More complex regulatory relationships are reflected in the expression dynamics. Nodal activates its own transcription, lefty, and not. Lefty is an antagonist of Nodal signaling (Duboc et al., 2008; Nam et al., 2007; Range et al., 2007).

