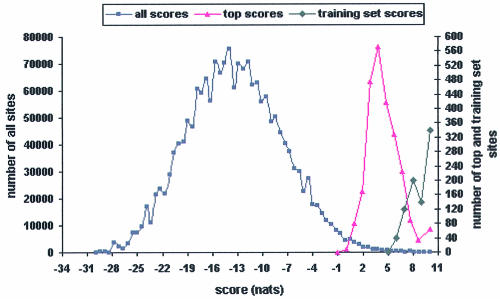
Figure 4.
Distribution of site scores. (Squares) All 8mer scores in the upstream regions of all TUs in B.subtilis; (triangles) top scores in the upstream regions of all TUs in B.subtilis; (diamonds) top scores in the combined training set. The frequency of the training set scores was multiplied by 20 for presentation purposes.

