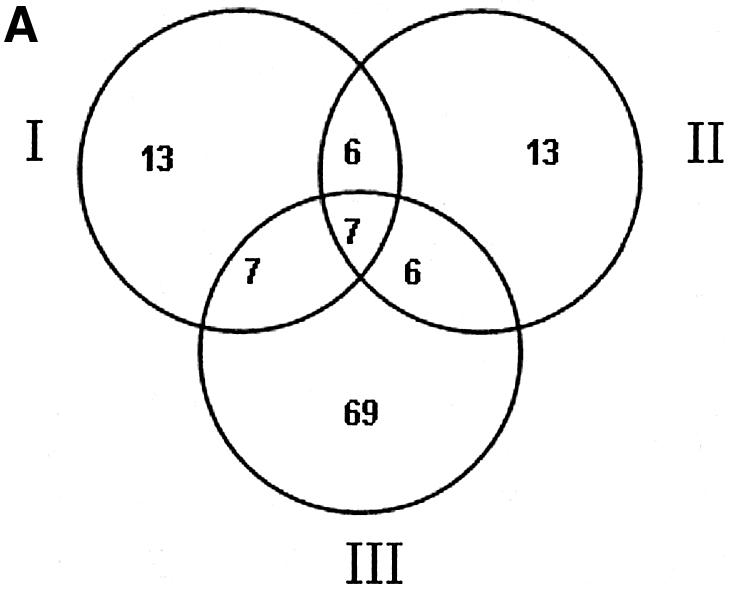
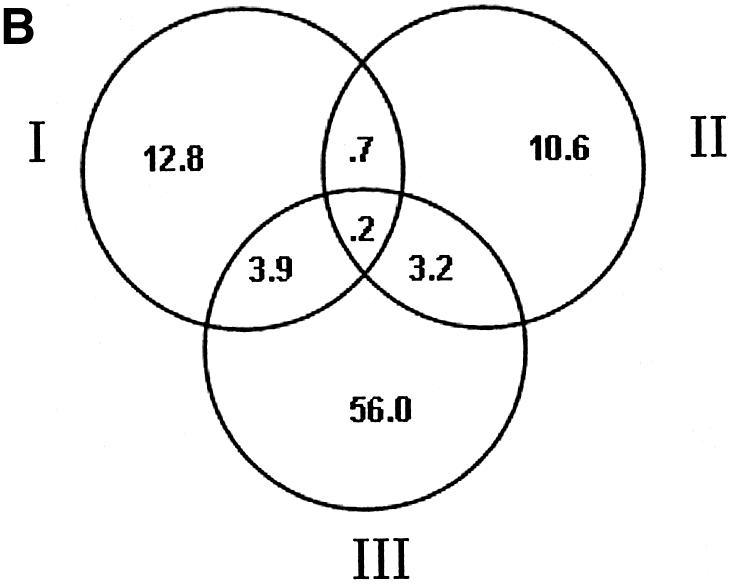
Figure 5.


Venn diagrams showing observed and expected numbers of TUs in B.subtilis supported by different types of evidence. (A) The observed numbers of TUs. (B) The expected numbers of TUs. I, number of TUs conserved between B.subtilis and B.halodurans and having putative Spo0A-phosphate binding sites; II, number of TUs conserved between B.subtilis and B.anthracis and having putative Spo0A-phosphate binding sites; III, number of TUs in B.subtilis whose transcript levels are at least 3-fold dependent on spo0A and have putative Spo0A-phosphate binding sites.
