
Figure 1.
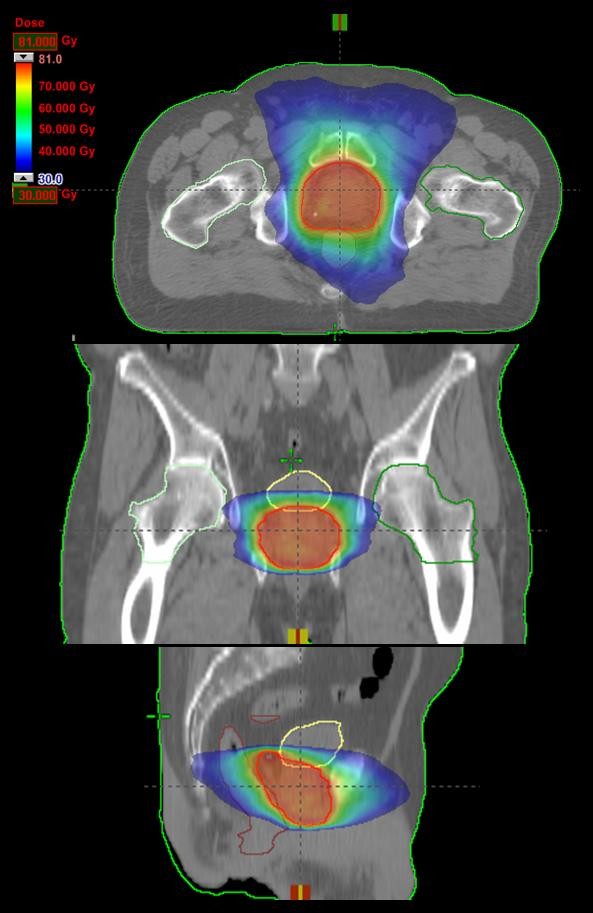
Isodose distributions for one example patient for RA treatments for an axial plane, sagittal and coronal views. Doses are shown in colorwash within the interval from 30 to 81 Gy.
Official websites use .gov
A
.gov website belongs to an official
government organization in the United States.
Secure .gov websites use HTTPS
A lock (
) or https:// means you've safely
connected to the .gov website. Share sensitive
information only on official, secure websites.
Isodose distributions for one example patient for RA treatments for an axial plane, sagittal and coronal views. Doses are shown in colorwash within the interval from 30 to 81 Gy.