
Figure 5.
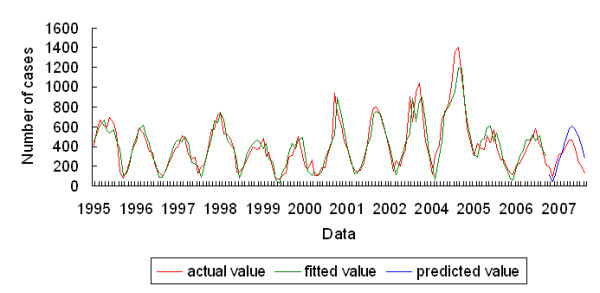
Fitted, predicted and actual numbers of malaria cases in Hainan, China, 1995-2007. The F of the model fitting was 85.06 (P < 0.05), and the adjusted R 2 was 0.81. The fitted and predicted values were close to the actual value (R 2 = 0.70).
Official websites use .gov
A
.gov website belongs to an official
government organization in the United States.
Secure .gov websites use HTTPS
A lock (
) or https:// means you've safely
connected to the .gov website. Share sensitive
information only on official, secure websites.
Fitted, predicted and actual numbers of malaria cases in Hainan, China, 1995-2007. The F of the model fitting was 85.06 (P < 0.05), and the adjusted R 2 was 0.81. The fitted and predicted values were close to the actual value (R 2 = 0.70).