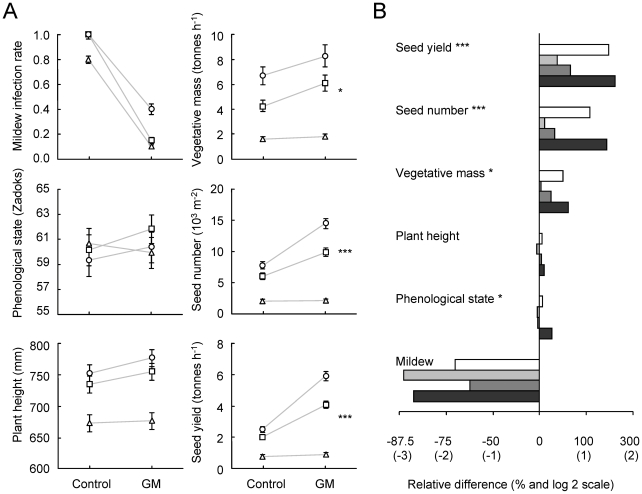
Figure 2. Effects of the transgene in the glasshouse on mildew infection and plant performance traits.
The mildew infection equals the proportion of pots with strong powdery mildew infection up to flag leaves. Phenological stage, plant height, vegetative mass, seed number and seed yield were measured to assess the plant performance. A: mean of four lines (Control = S3b#1–4; GM = Pm3b#1–4) at different soil nutrient levels (circles = high fertilizer, squares = medium fertilizer, triangles = no additional fertilizer); significant transgene × fertilizer environment interactions indicated by asterisks (vegetative mass: P = 0.035, seed number: P<0.001, seed yield: P<0.001); light grey lines were drawn to make these interactions visible; error bars represent ±1 standard error (back-transformed, see methods) and are sometimes hidden behind the symbols. B: proportional difference between GM and control plants for each of the four offspring lines but averaged across nutrient levels (white bars = offspring pair 1 (Pm3b#1 vs. S3b#1), light grey = offspring pair 2, dark gray = offspring pair 3, black bars = offspring pair 4); x-axis log-scale with original values (100 * GM/control); bars extending to the right from the vertical zero line indicate higher values in GM than in control plants; significant GM/control x offspring pair interactions indicated by asterisks (* P<0.05; ***P<0.001).

