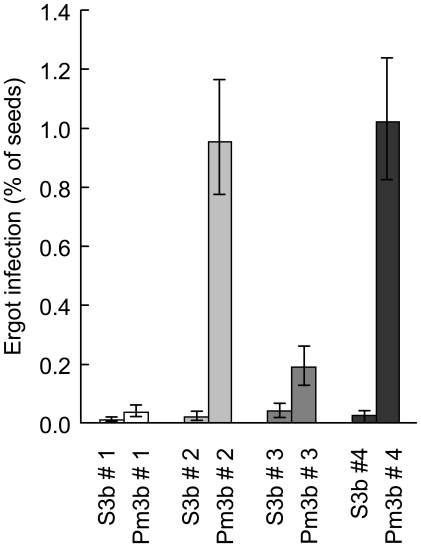
Figure 4. Percentage of ergot infected seeds in GM and control plants in the field.
White bars = offspring pair 1, light grey = offspring pair 2, dark grey = offspring pair 3, black bars = offspring pair 4. Within each pair, the bar to the left shows control line and the bar to the right shows the corresponding GM line. Error bars represent ±1 standard error (back-transformed from cube root scale.

