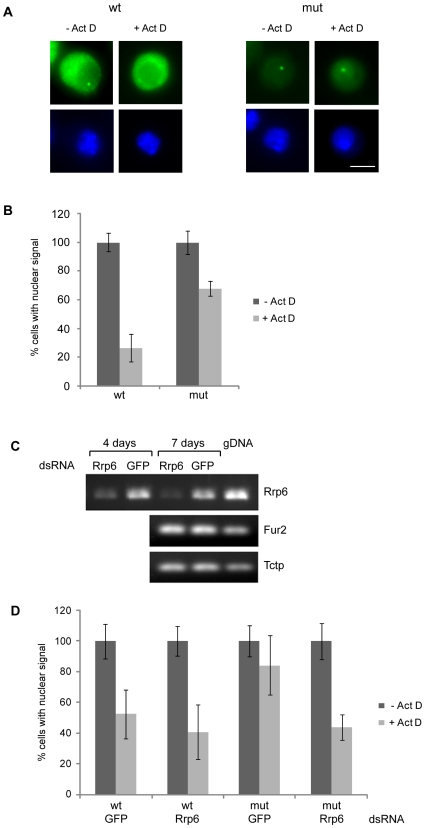
Figure 2. Nuclear retention of mutant β-globin transcripts in S2 cells.
(A) The location of the β-globin RNAs studied by FISH. Expression of the wt and mut β-globin genes was induced with 400 µM CuSO4 for 24 h and the location of the β-globin transcripts was analyzed by FISH. The β-globin sequence of the pβΔRS plasmid was labeled with digoxigenin and used as a probe (green). The preparations were counterstained with DAPI (blue). When indicated, the cells were treated with actinomycin D before fixation to study the presence of transcripts at the transcription site in the absence of ongoing RNA synthesis. The magnification bar represents 5 µm. (B) Quantitative analysis of the FISH experiments. The frequency of cells with an intensely fluorescent spot in the nucleus was counted in control cells (Act-, dark bars) and in cells treated with actinomycin D (Act+, light bars). For each treatment, 98 cells were analyzed. The experiment was carried out three independent times, with a total of 294 cells analyzed. To show the changes induced by actinomycin D, the results are expressed as average percentage relative to the frequencies obtained in non-treated cells. The error bars represent standard deviations of the mean (n = 3). Comparisons of wt to mut treated with actinomycin D using a paired, one-tailed Student's t-test gave p = 0.02, n = 3. (C) Depletion of Rrp6 by RNAi in S2 cells. S2 cells were treated with either Rrp6-dsRNA or control GFP-dsRNA. After 4 days or 7 days, as indicated, total RNA was purified and reverse-transcribed. The resulting cDNA was analyzed by PCR with primers specific for the rrp6 gene. The expressions of two unrelated genes, fur2 and tctp, were analyzed in parallel to assess the specificity of the treatment. Genomic DNA was analyzed in parallel. Equivalent amounts of cells expressing wt and mut transcripts were used for the analysis. (D) Depletion of Rrp6 restores the release of β-globin transcripts from the transcription site. The distribution of the β-globin transcripts was analyzed by FISH in cells treated with either Rrp6-dsRNA or GFP-dsRNA for 5 days. Induction, actinomycin treatment and FISH analysis were the same as those described for Figures 2A and 2B. The histogram shows the average proportion of cells with an intense fluorescent spot. Dark bars indicate data from non-treated control cells. Light bars correspond to cells treated with actinomycin D before fixation and FISH analysis. A total of 392 cells from two independent experiments, each in duplicate, was analyzed for each treatment. The error bars represent standard deviations (n = 4). Comparisons of cells expressing mut RNA and treated with Rrp6-dsRNA with those treated with GFP-dsRNA in the presence of actinomycin D using an unpaired, one-tailed Student's t-test gave p = 0.03, n = 4.

