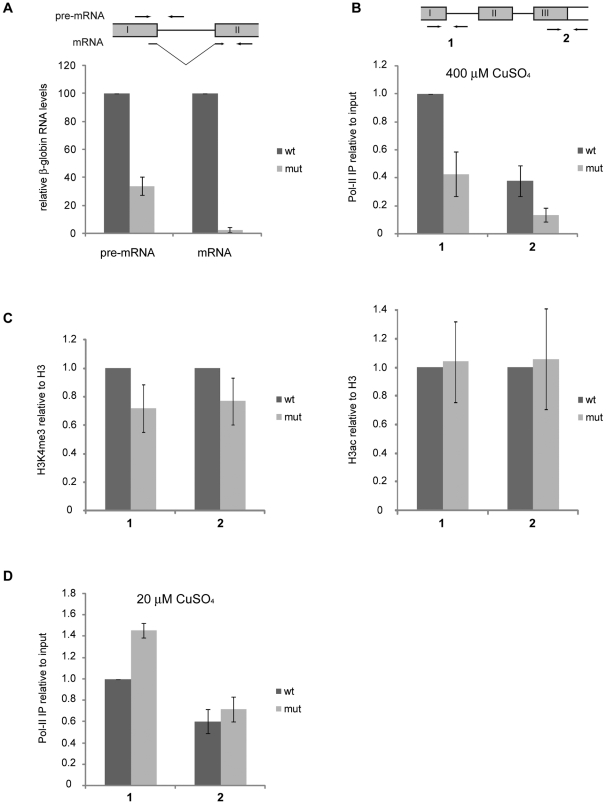
Figure 4. Expression of the mut and wt β-globin genes in S2 cells.
(A) The relative levels of β-globin transcripts analyzed by RT-qPCR. The expression of the β-globin genes was induced with 400 µM CuSO4, and total RNA was purified and reverse-transcribed. β-globin pre-mRNA and mRNA levels were quantified by RT-qPCR using specific primers as indicated in the figure. The histogram shows average relative transcript levels normalized to actin 5C. The error bars are standard deviations from three independent experiments, each in duplicate (n = 6). Comparisons between wt and mut using a paired, two-tailed Student's t-test gave p<0.001 and p<0.0001 (n = 6) for pre-mRNA and mRNA, respectively. (B) Analysis of Pol-II density in β-globin genes. Expression of the β-globin genes was induced as described above (400 µM CuSO4, high induction conditions) and the density of Pol-II in the mut and wt β-globin genes was analyzed by ChIP using an anti-CTD antibody. Two regions near the promoter (region 1) and the stop codon (region 2) of the β-globin gene were analyzed by qPCR using specific primers as indicated in the figure. The histogram shows average Pol-II signals relative to input and normalized to actin 5C from three independent experiments, each one quantified twice by qPCR (n = 6). The error bars represent standard deviations. Comparisons between wt and mut using a paired, two-tailed Student's t-test gave p<0.0001 and p<0.005 (n = 6) for regions 1 and 2, respectively. (C) Analysis of chromatin modifications in the β-globin genes (400 µM CuSO4, high induction conditions) by ChIP using antibodies against histone H3, H3K4me3 and H3ac. The immunoprecipitated DNA was measured by qPCR using primers for β-globin regions 1 and 2, as in (B). The histograms show the average signals for H3K4me3 (left) and H3ac (right) relative to histone H3 and normalized to actin 5C from three (H3K4me3) and two (H3ac) independent experiments, each quantified in duplicate (n = 6 and n = 4 for H3K4me3 and H3ac, respectively). The error bars represent standard deviations. Comparisons of H3K4me3 occupancy between wt and mut using a paired, two-tailed Student's t-test gave p = 0.06 and p = 0.04 (n = 6) for regions 1 and 2, respectively. No significant differences were found for H3ac (p>0.9 and p>0.8, n = 4, for regions 1 and 2, respectively). (D) Analysis of Pol-II density in β-globin genes under low induction conditions. The density of Pol-II in the mut and wt β-globin genes was analyzed by ChIP as in (B) after induction with 20 µM CuSO4. The histogram shows average Pol-II signal relative to input and normalized to actin 5C from two independent experiments each quantified in duplicate (n = 4). Paired, two-tailed Student's t-test p values for comparisons of Pol-II density between wt and mut were 0.002 and 0.14 (not significant difference) for regions 1 and 2, respectively.

