
Fig. 4. Autoradiograms of Northern blot hybridizations.
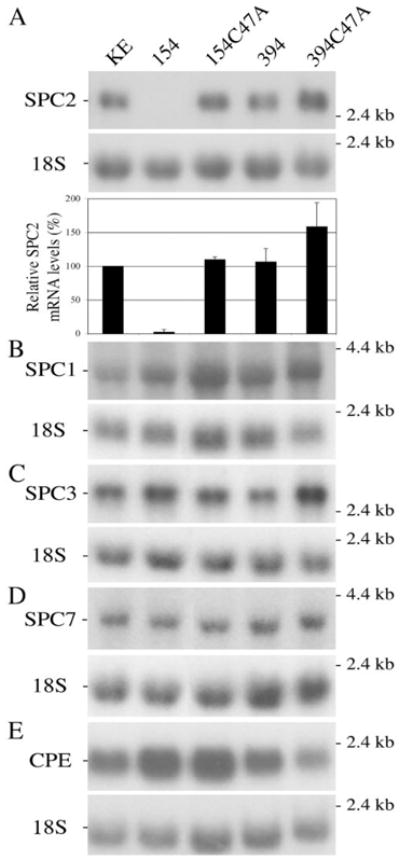
A, analysis of SPC2 mRNA is presented in the upper panel. The levels of SPC2 mRNA were analyzed in the five established cell lines. The lower panel illustrates the relative expression of SPC2 mRNA by densitometric analysis (using the KE cell line as a reference; n = 3). Each band was normalized with the corresponding 18 S ribosomal RNA band. B–E, analysis of SPC1, SPC3, SPC7, and CPE mRNAs levels, respectively. The size markers are shown on the right.