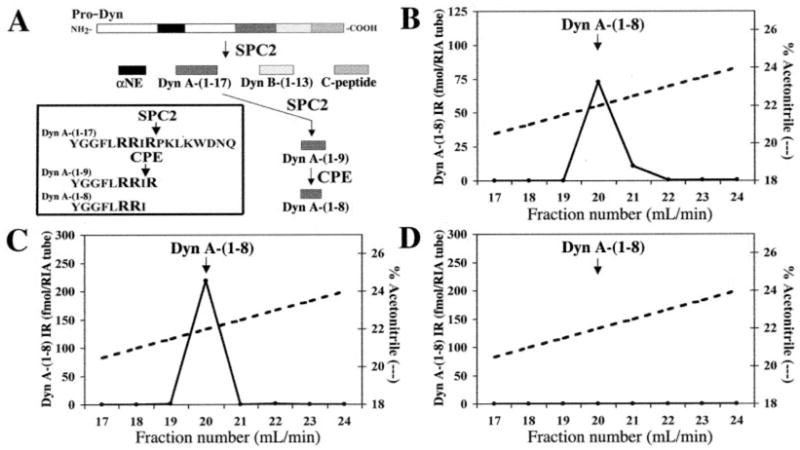
Fig. 7. RP-HPLC analysis of cellular extracts for their Dyn A-(1–8) IR content.

A, schematic representation of pro-Dyn processing by SPC2, SPC3, and CPE producing either α-neo-endorphin, Dyn A-(1–17), Dyn B-(1–13), C-peptide, Dyn A-(1–9), or Dyn A-(1–8). In the inset, basic amino acids found at the cleavage sites of Dyn A-(1–17) as shown. Total protein extracts from untransfected βTC-3, 394, and 154 cell lines were submitted to RP-HPLC (B–D, respectively). 50 μg of total proteins was injected for βTC-3 and 394-1 and 0.5 mg for cell line 154. The values are expressed on the ordinate as femtomoles per RIA tube. The gradient used for the RP-HPLC analysis is indicated (dashed lines) as percentage of ACN (ordinate axis on the right). The arrows indicate the elution position of a standard peptide (14 min, 22% ACN).
