Figure 2.
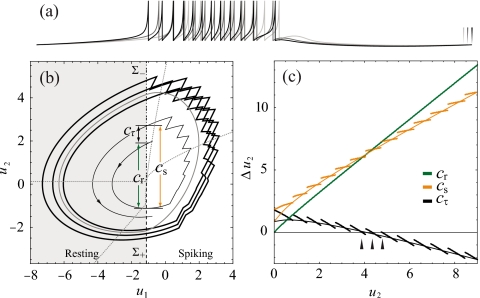
Multirhythmic bursting produced by Eqs. 3, 4, 5. (a) Voltage traces showing a single period of three coexisting, limit cycles of 10, 11, and 12 spikes. Note that the period of coexisting bursting solutions is different as indicated by three endpoint markers. (b) The corresponding limit cycles projected into the plane of the slow variables (thick) with the averaged solution shown in gray. Dotted gray lines are the nullclines of the averaged bursting system [see Eqs. 13, 14]. Contraction metrics, Cr, Cs, and Cτ [Eqs. 9, 10, 11] are demonstrated on a portion of a trajectory of the full system spiraling outward (thin). The dashed line (Σ+) and dot-dashed line (Σ−) are the Poincaré sections used to define G and H [Eqs. 6, 7]. (c) Cr, Cs, and Cτ for the multirhythmic system in (a). When the contraction of the slow focus is balanced by expansive spiking events, Cτ=0 and there is a fixed point of the map. Contraction metrics for the averaged system are thin solid lines. Parameters used here are I=0.5 (I=1.2 for averaged system), α=0.2, β=0.05, d1=0.4, d2=0.6, vc=10, and vr=−1.

