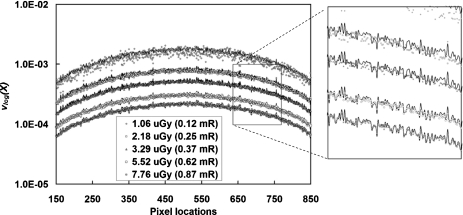
Figure 12.
Pixel variance after logarithmic process with dynamic gain mode. The pixel noise variance after logarithmic preprocessing is shown with different radiation kerma levels at different pixel locations in a single row of the detector. Only the pixel region with dynamic gain mode was shown (#150–#850). The discrete data points were calculated from experimentally measured data using Eq. 4. The solid lines (closely overlapped with the discrete data points, as shown in the magnified view on the right) were calculated from empirical prediction using Eq. 5b, with measured fitting coefficients and additive noise measured from offset images. These data clearly proved the quadratic relationship described in Eq. 5b.

