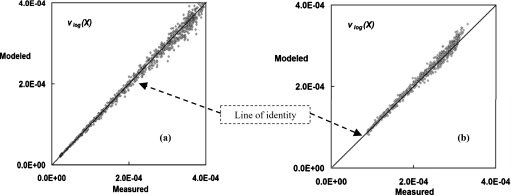
Figure 13.
Verification of the quadratic relationship. As another way to prove the quadratic relationship from Eq. 5b, the pixel noise variance after logarithmic preprocessing from a single row of the detector were plotted for (a) fixed low gain mode and (b) dynamic gain mode. The air kerma level was 5.52 μGy for a 156 mm polyethylene cylinder. Values from experimental measurements were used as the x-axis and values calculated from the quadratic model in Eq. 5b were used as the y-axis. A very close distribution of the data points around the line of identity verifies that the pixel variance after logarithmic preprocessing is determined by the quadratic relationship from Eq. 5b.

