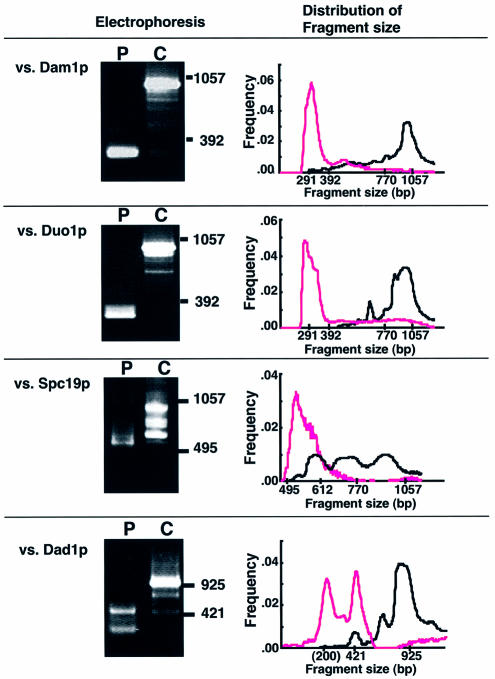
Figure 2.
Convergence of the selected fragments by PASA-PCR. The plasmid pool obtained from interaction-positive clones with the indicated binding partner (yeast colonies grown on the selection plates) was amplified by PASA-PCR (lanes P) or conventional PCR (lanes C). The amplified fragments were subjected to agarose gel electrophoresis. Bars with numbers on the right indicate the migration points of size markers (base pair). The size distribution of the amplified fragments was analyzed using gel-image analyzer (NIH image ver. 1.59), and represented as scatter diagrams (right panels). x and y axes of the graphs represent amplified fragment size (base pair, in logarithmic scale) and frequency (total = 1.0), respectively. The positions where the size markers were migrated are indicated on the x axis. Dots in magenta and black represent the frequency of the fragment in PASA-PCR and conventional PCR, respectively.

