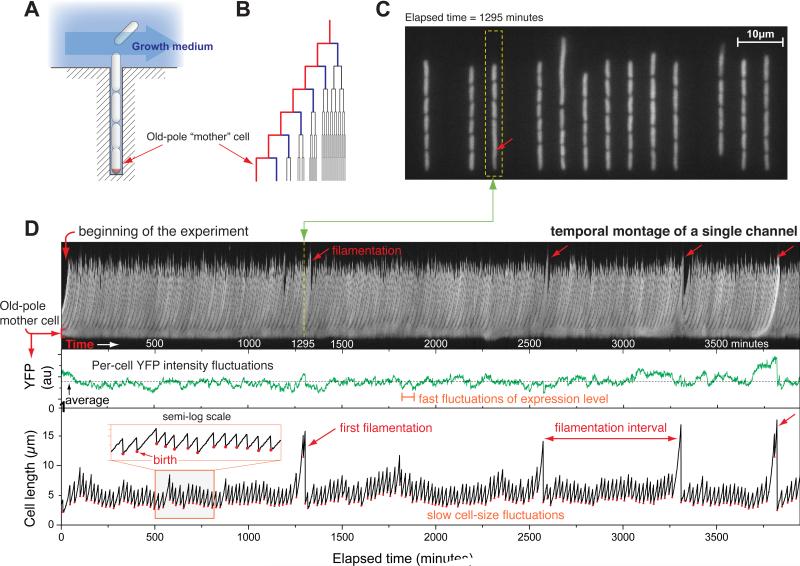
Fig. 1.
The “mother machine” and high-throughput observation of the mother cells. (A) Schematic illustration of the microfluidic mother machine. The old-pole mother cell is trapped at the end of the growth channel. (B) The outer-most branch of the lineage tree represents the old-pole mother cell and her progeny. (C) Snapshot of a typical field of view. (D) (top panel) Temporal montage of a single growth channel [within the dotted yellow box in (C)] from the beginning to the end of the experiment. The stable band on the bottom of the montage is the old-pole mother cell, whereas the “feather” of the montage show the growth and escape of her progeny; (mid panel) the average YFP intensity of the mother cell fast fluctuating around the mean without decay with time; (bottom panel) cell length vs. time of the old-pole mother cell, which shows occasional spikes (filamentations). In all three panels, the x-axis represents time in minutes.

