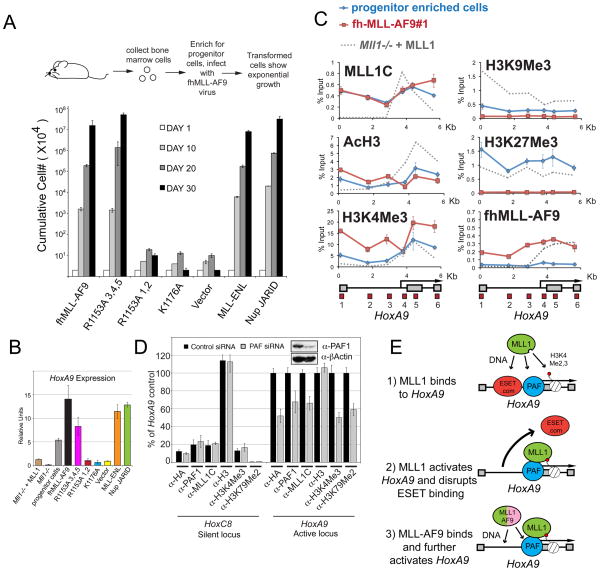
Figure 7. Recruitment of fh-MLL-AF9 to HoxA9 in bone marrow cells is essential for leukemic transformation.
(A) Leukemogenic transformation of MLL-AF9 constructs. Retrovirally expressed FLAG and HA tagged (fh-) MLL-AF9 fusion protein constructs that were either normal for MLL-AF9 or had R1153A (PAF1 disruption), or K1176A (DNA binding disruption) point mutations were transduced into murine bone marrow cells, along with empty vector, untagged MLL-ENL, and triple FLAG tagged NUP98-Jarid controls. Error bars represent the standard deviation of averaged, cumulative cell numbers across five independent lines for each construct. (B) HoxA9 expression in transformed and control cell lines. Cells from (A) were tested for HoxA9 expression and the average values across all five independent cell lines per construct are shown. Error bars represent standard deviation. HoxA9 expression in Mll1−/− and Mll1−/− + MLL cell lines are also shown for comparison. (C) ChIP in progenitor enriched (Blue line) and fh-MLLAF9 (line #1, Red line) cells with the antibodies indicated. ChIP experiments in Mll1−/− + MLL cells are shown for comparison (Grey dots). (D) PAF1 is required for MLL1 and MLL-AF9 binding to HoxA9. The fh-MLLAF9#1 cell line was treated with control vs PAF1 siRNA’s and the cells were subjected to western blot (inset) and ChIP analysis using the antibodies indicated. α-HA antibody recognizes the HA tagged MLL-AF9 fusion protein. ChIP results were quantified using a primer/probe set for the silent Hoxc8 locus or the mouse HoxA9 coding region (primer/probe set 5 from D). ChIP signal was quantified to inputs and then relative to the HoxA9 control signal which was arbitrarily set to 100. (E) 1= wild type MLL1 is recruited to HoxA9 through interactions with H3K4Me, PAF1 and DNA. 2= MLL1-mediated activation of the HoxA9 locus disrupts binding of repressors such as ESET and creates a more “open” chromatin conformation. 3= An MLL1 fusion protein can now bind through interactions with PAF1 and with CpG rich DNA. ChIP results shown are typical for at least two independent experiments. Error bars represent standard deviation of three separate PCR reactions. See also Figure S7.

