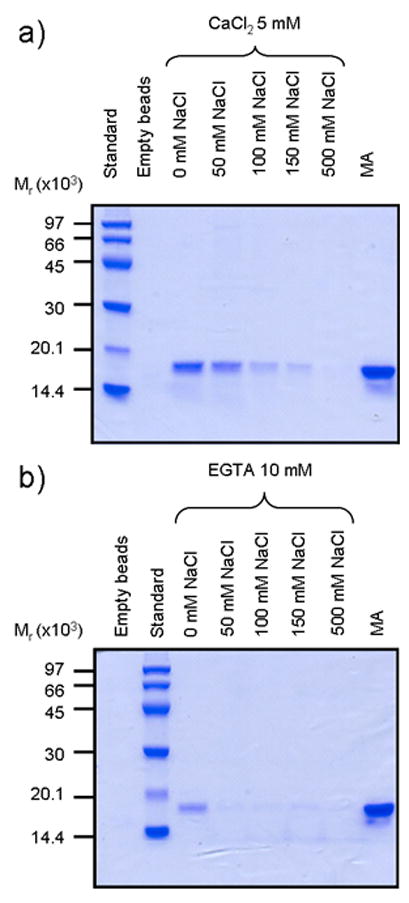
Figure 2. Effect of Ca2+ and NaCl on the interaction between CaM and MA monitored by SDS-PAGE pulldown assays.

Molecular mass marker sizes (Mr) are shown along the left edge. a) Interactions between CaM and MA in high calcium buffer. Lane 1: molecular mass standards; lane 2: CaM-agarose beads only; lanes 3–7: CaM-agarose + MA in 0, 50, 100, 150, or 500 mM NaCl; lane 8: MA alone. b) Interactions between CaM and MA in low calcium buffer. Lane 1: CaM-agarose beads only; lane 2: molecular mass standards; lanes 3–7: CaM-agarose + MA in 0, 50, 100, 150, or 500 mM NaCl; lane 8: MA only.
