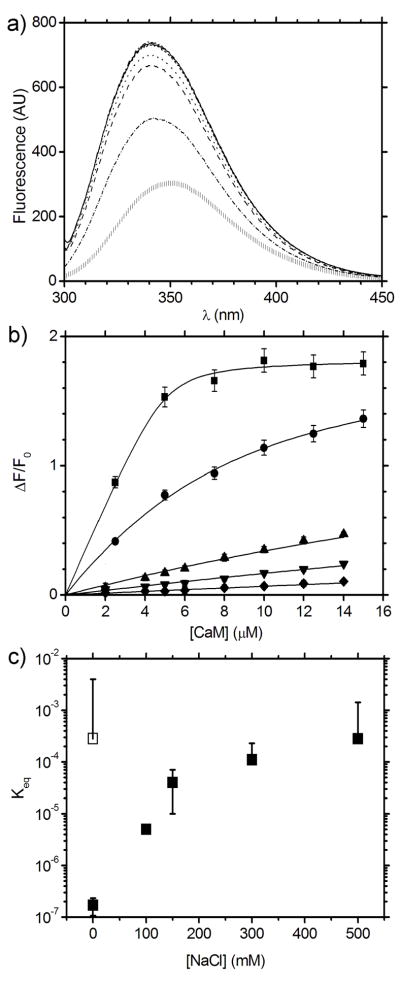
Figure 3. Dependence of the affinity between Ca2+-CaM and MA as a function of NaCl concentration.
a) Tryptophan fluorescence emission spectra for the titration of Ca2+-CaM and MA in 0 mM NaCl demonstrating the shift in peak emission wavelength from MA alone ( | ) to saturated Ca2+-CaM-MA (solid line). b) Change in fluorescence intensity (ΔF/F0) from MA at 334 nm upon binding Ca2+-CaM as a function of [NaCl]: 0 mM NaCl (■); 100 mM (●); 150 mM (▲); 300 mM (▼); and 500 mM (◆). Each data point is the average of measurements and the error bars correspond to ± 1 standard deviation. c) CaM-MA Keq vs. NaCl concentration in the presence of Ca2+ (■), and in the absence of Ca2+ (with EGTA chelator, □).

