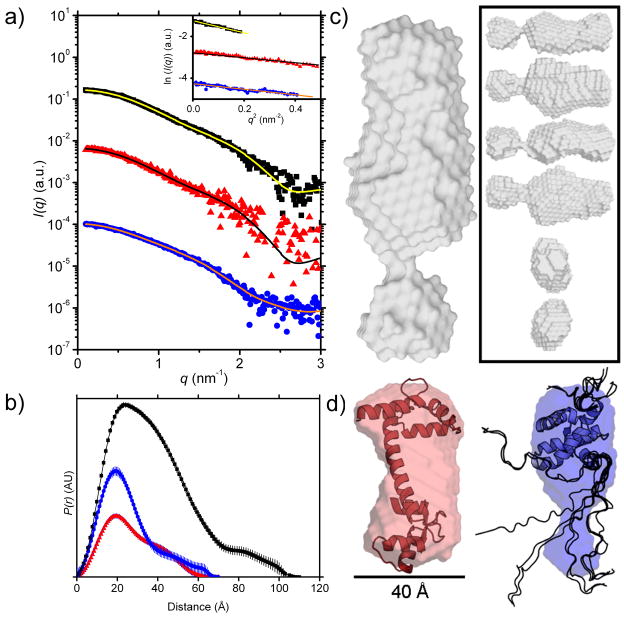
Figure 4. SAXS analysis of Ca2+-CaM, MA, and Ca2+-CaM-MA.
a) I(q) vs. q plots of SAXS data for the complex (black ■, 9.7 mg.mL−1), Ca2+-CaM (red ▲, 5.0 mg.mL−1), and MA (blue ●, 8.0 mg.mL−1). The plots for Ca2+-CaM and MA have been arbitrarily shifted on the vertical axis for clarity. Superimposed lines indicate the P(r) fit to the data. (Inset) Guinier plots (data points) and linear fits (lines) to the SAXS data for the complex (black ■), Ca2+-CaM (red ▲), and MA (blue ●) to qRg < 1.3. The plots for Ca2+-CaM and MA have been arbitrarily shifted on the vertical axis for clarity. All curves are linear as expected for monodisperse samples. Propagated errors based on counting statistics were smaller than symbol size in low q region (< 0.15 Å−1) and indicated by the scatter around the fitted lines at higher q. b) SAXS P(r) profiles for the complex (black ■, Dmax = 110 Å), Ca2+-CaM (red ▲, Dmax = 70 Å), MA (blue ●, Dmax = 60 Å). c) Ca2+-CaM-MA envelope (grey), (inset) different orientations of Ca2+-CaM-MA (grey), d) free Ca2+-CaM with superimposed structure (left, red, PDB entry: 1CLL) plus scale bar and free MA with superimposed structure (right, blue, PDB entry: 2HMX, NMR ensemble models 1–10 out of 20). Structures are drawn to relative scale. MA contains two unstructured regions in the NMR ensemble model (rendered as backbone ribbons): an N-terminal domain around residues 1–10 and the C-terminal ‘tail’ around residues 106–132 which is unstructured according to the NMR data; the shape restoration suggests that the unstructured C-terminal tail is more compact than indicated by the NMR coordinate files.

