
Figure 5. 15N-1H-HSQC spectra for 15N-CaM bound to MA and 15N-MA bound to Ca2+-CaM.
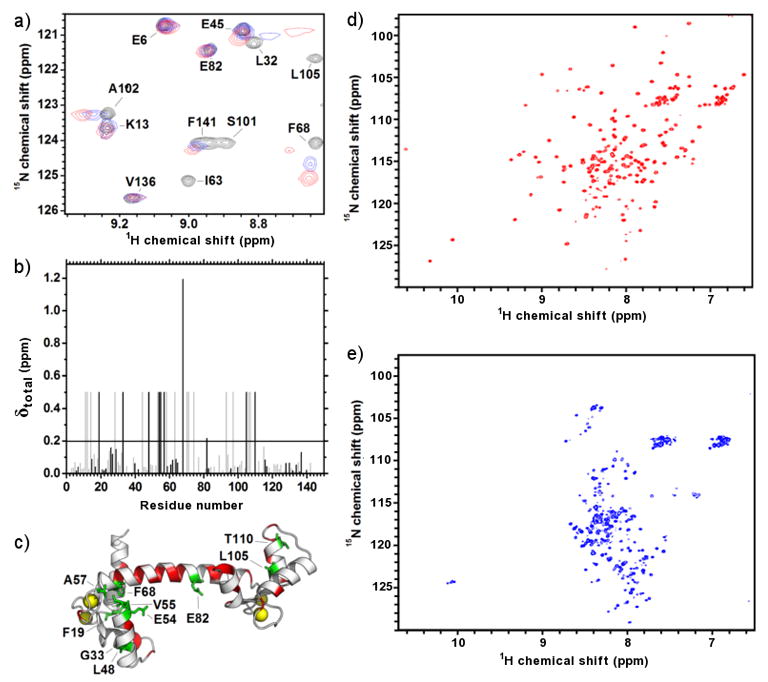
a) Focused region of the HSQC spectra showing the titration of 15N-CaM (black) with unlabelled MA (0.4:1 molar ratio, blue; 1:1 molar ratio, red). b) Amide chemical shift perturbations for 15N-CaM bound to MA indicating unambiguously assigned residues (black) and those which are tentatively assigned (grey). The significant threshold for perturbation (average perturbation + 1 standard deviation) is indicated by a horizontal line. Amide resonances that disappear during complex formation are set to an arbitrary value of 0.5. c) Annotated structure (pdb: 1CLL) of Ca2+-CaM showing unambiguously assigned and perturbed residues (green) and unassigned residues (red). Bound calcium atoms are shown as yellow spheres. The proposed interaction surface of CaM-MA from previous SAXS studies41 (inset i, orange) and the interaction surface between in Ca2+-CaM-MLCK26 (inset ii, black) is on the same Ca2+-CaM structure for comparison. d) HSQC spectra for 15N-MA in the absence of CaM showing well dispersed peaks. e) HSQC spectra for 15N-MA in complex with unlabelled CaM demonstrating perturbations in most of the amide resonances.