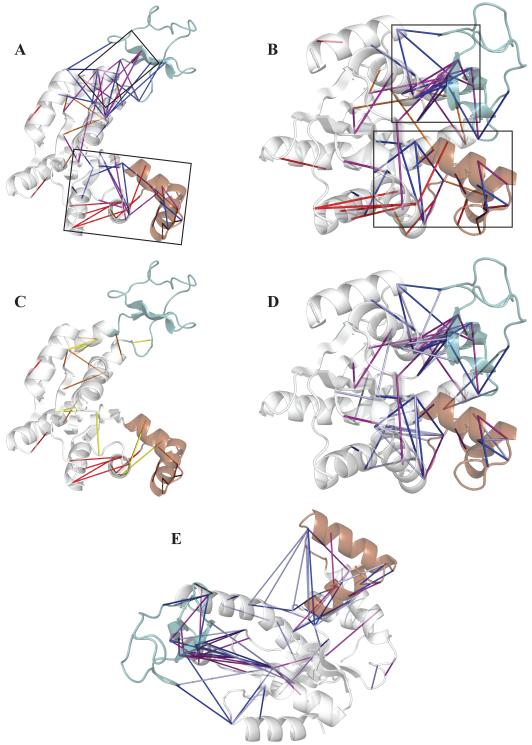
Figure 4. Important O-characteristic and C-characteristic contacts in the transition state ensemble of the bound simulation.
CORE, LID and NMP domains are colored white, green, and brown, respectively. Only contacts with max(pO, pC) ≥ 0.5 are plotted. For O-characteristic contacts (pC-pO ≤ −0.2), red, orange, and yellow indicate pTS ≥ 0.7, 0.5 ≤ pTS < 0.7, and pTS < 0.5, respectively. For C-characteristic contacts (pC-pO ≥ 0.2), purple, blue, and light blue indicate pTS ≥ 0.7, 0.5 ≤ pTS < 0.7, and pTS < 0.5, respectively. A: TSE contacts (pTS ≥ 0.5) mapped onto the O crystal structure (4AKE). B: TSE contacts mapped onto the C crystal structure (1AKE). Boxes on panels A and B indicate the two proposed transition state contact nuclei. C: All O-characteristic contacts. D: All C-characteristic contacts. E: C-characteristic contacts mapped onto O crystal structure.

