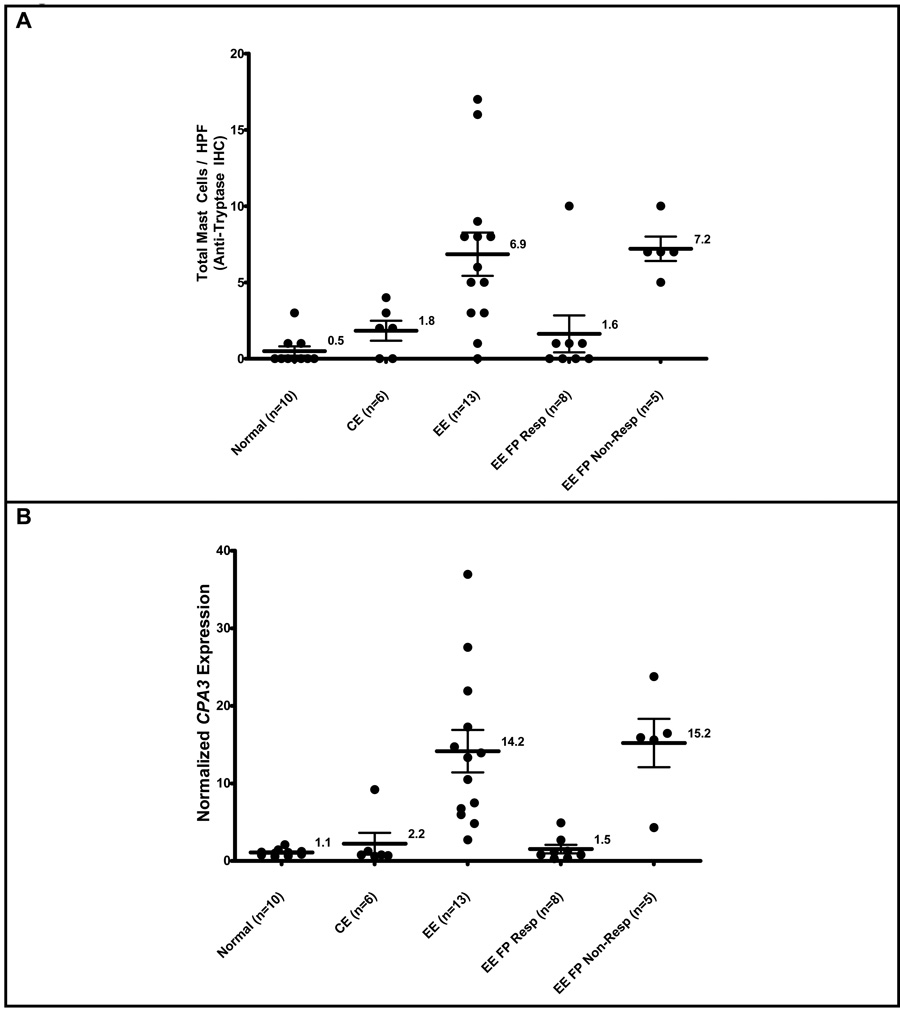
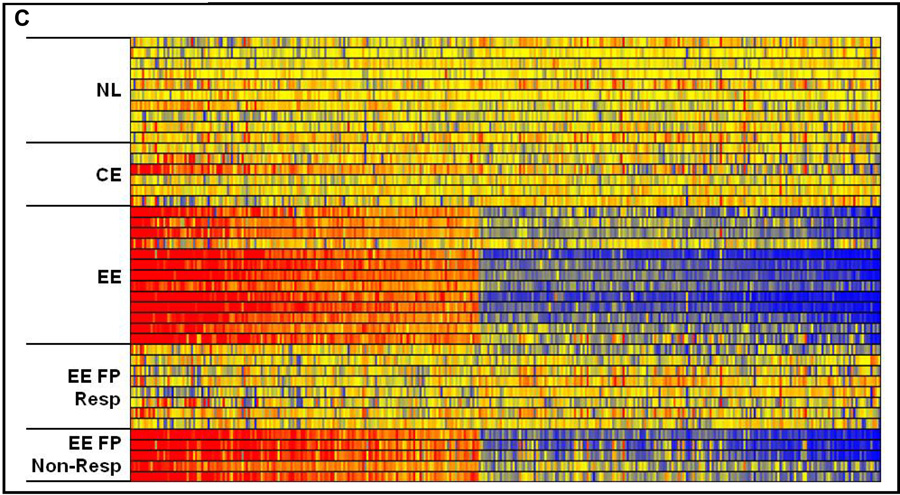
Figure 5. Mast cell counts, gene expression, and mast cell transcriptome in patients treated with swallowed FP.
Maximum mast cell counts from normal, CE, EE, and compared to EE patients whom responded to fluticasone propionate (EE FP Resp), or who did not respond to fluticasone propionate therapy (EE FP Non-Resp). Response to treatment with swallowed FP was defined as ≤ 1 eosinophil per HPF (A). CPA3 expression on microarray (B). The mast cell related-transcriptome under varying conditions listed above (C).


