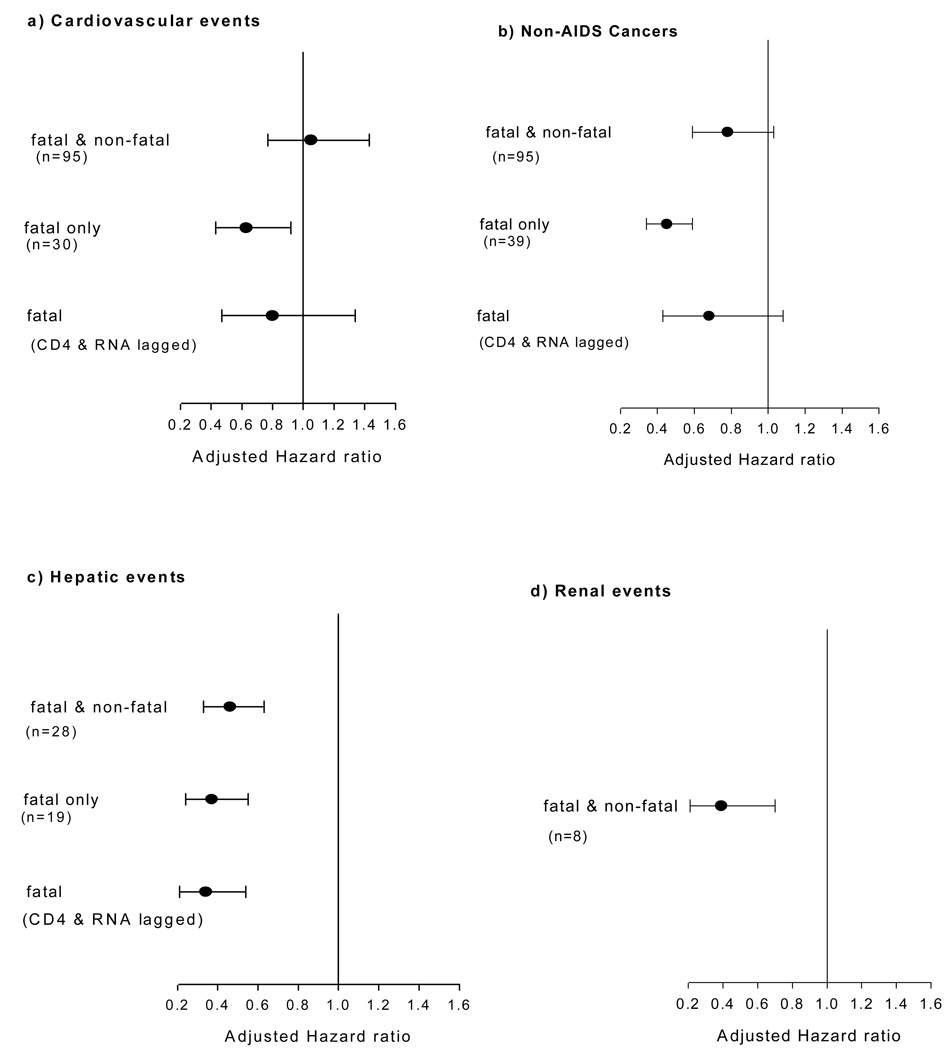
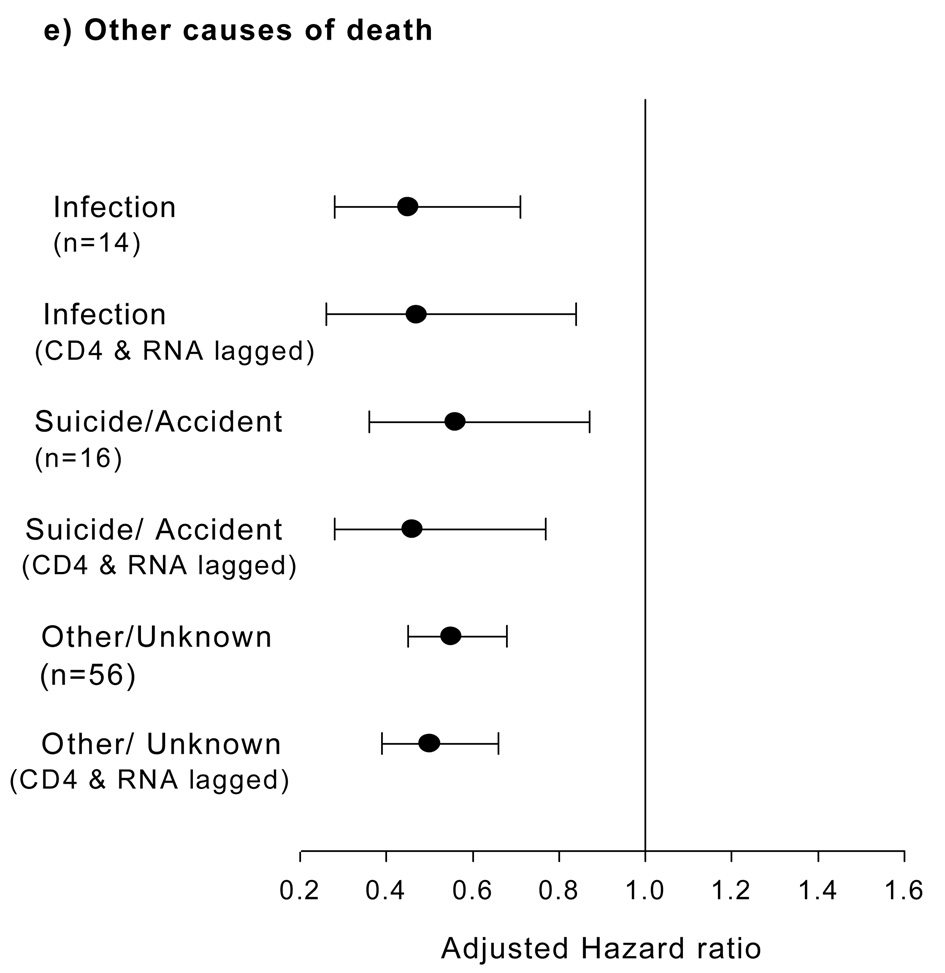
Figure-2. Latest CD4+ counts and specific non-AIDS events categories.
(a to e): Adjusted Hazard ratios (per log2 rise in CD4+ counts, with 95% CI) for the association between latest CD4 count and categories of serious non-AIDS diseases. For fatal events, CD4+ and RNA were lagged by 6-months in the model and adjusted hazard per log2 rise in CD4+ counts plotted.


