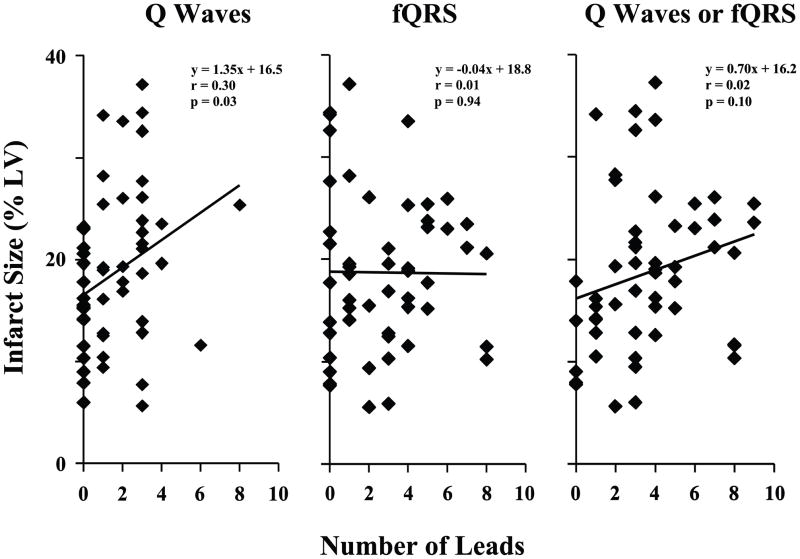
Figure 4. Infarct Volume as Predicted by Q Waves Alone, fQRS Alone, or Q Waves Combined with fQRS.
The left graph shows the correlation between infarct volume and the number of leads with pathologic Q waves (with leads V1 and aVR excluded) in patients with narrow QRS complexes (n = 52). Although the correlation was statistically significant, the relationship was weak and Q waves only accounted for 9% of the variability in infarct volume. The middle graph shows that although fQRS complexes are common in patients with ischemic cardiomyopathy, the number of leads with fQRS did not correlate with infarct volume. By combining Q waves and fQRS as indices of infarction (right graph), the number of affected leads significantly increased (to 3.6 ± 2.5, p < 0.001 vs. either Q waves or fQRS alone), but there was no improvement in the correlation with infarct volume than with Q waves alone.

