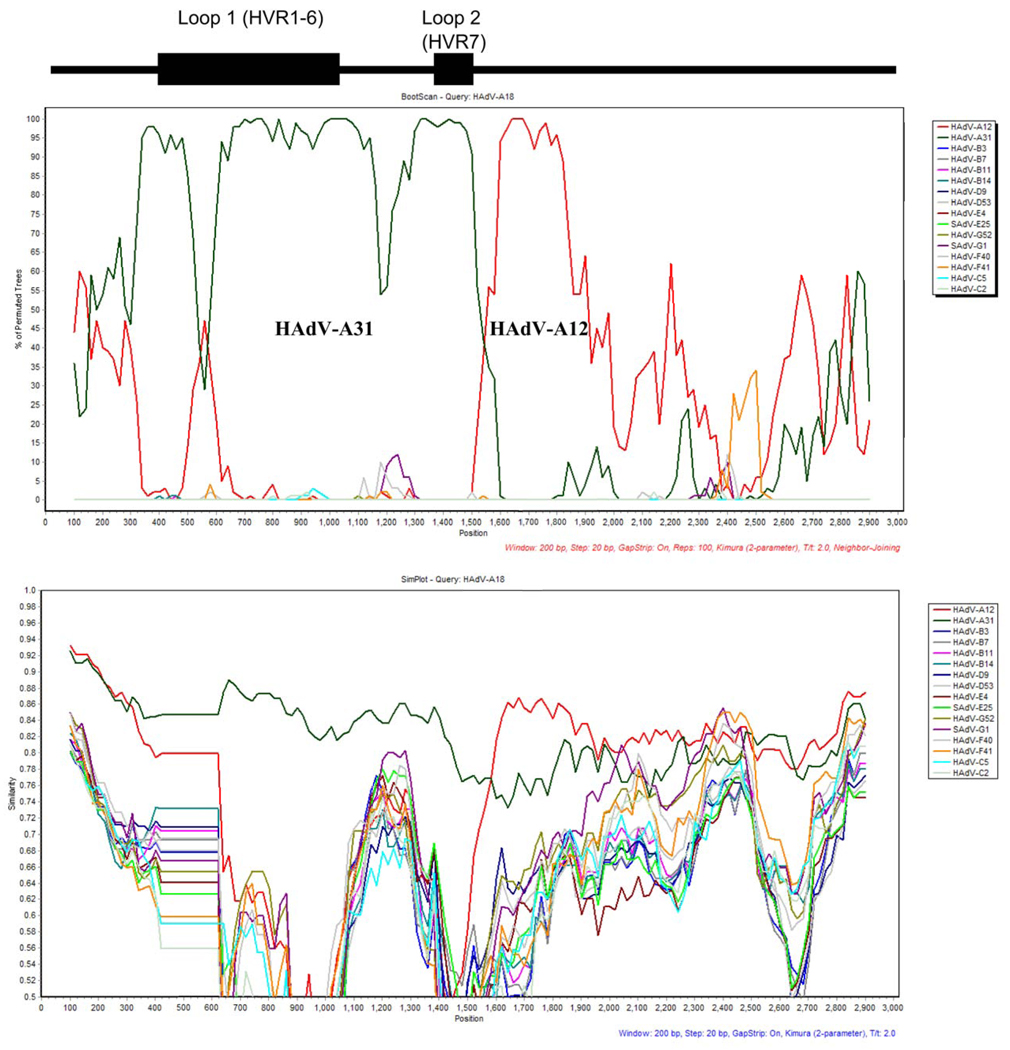
Figure 3.
Hexon recombination analysis. Bootscan (top panel) and simplot (bottom panel) recombination results are shown. The positions of the putative serotyping epitopes and the two hypervariable loops, of the hexon, are noted above the graphs as reference. The parameters are listed in red or blue lettering under each.

