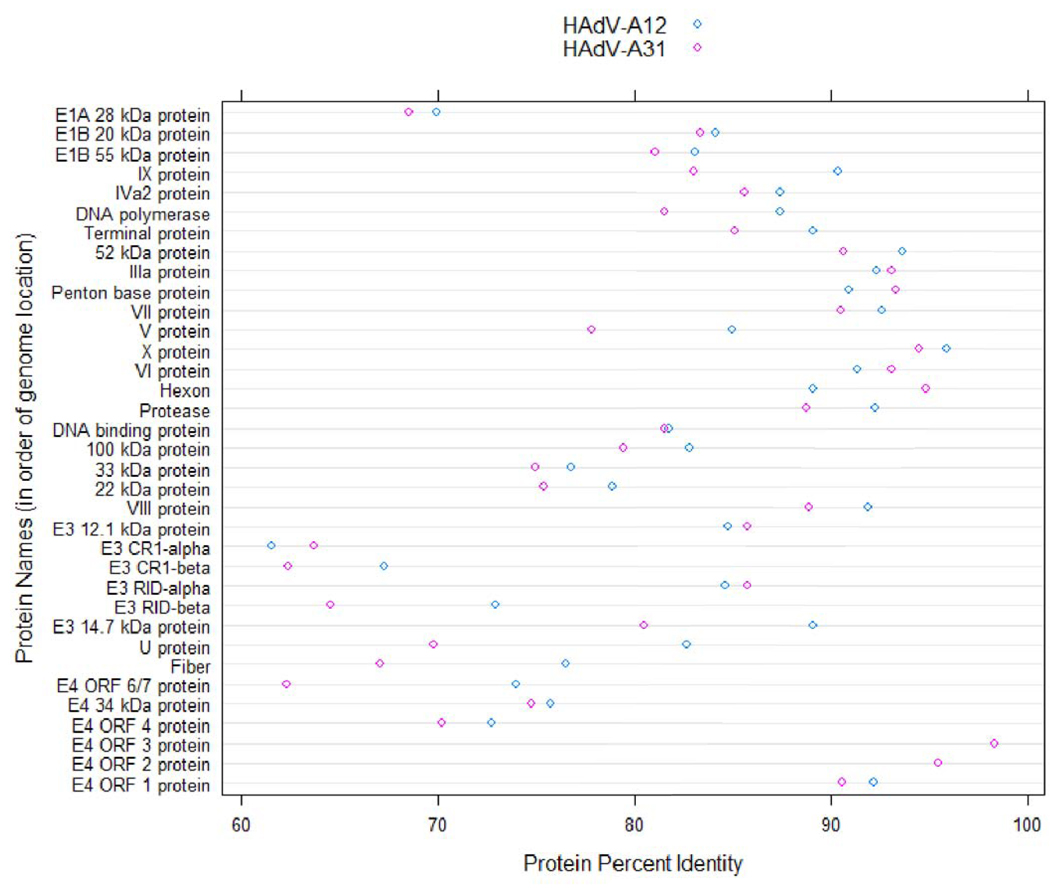
Figure 5.
Dotplot of Protein Percent Identities. The percent identities of proteins of HAdV-A18 to homologs in the other members of the HAdV-A species are plotted in a dotplot format. The proteins are sorted according to the location of their nucleotide coding sequence. This chart was constructed using the R statistical computing environment (http://www.R-project.org/).

