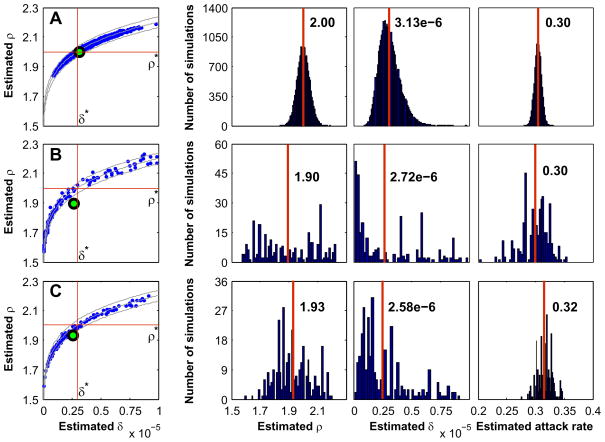
Fig. 4.
Scatter diagrams and histograms for the three estimator methods. The target values for all three cases are δ* = 3×10⁻⁶ and ρ* = 2. In the scatter diagrams the green dots are the sample means and the three curves are lines along which the expected severe attack rate is constant. In the histograms the vertical red lines indicate the sample means. (A) Method 1, (B) Method 2, (C) Method 3.

