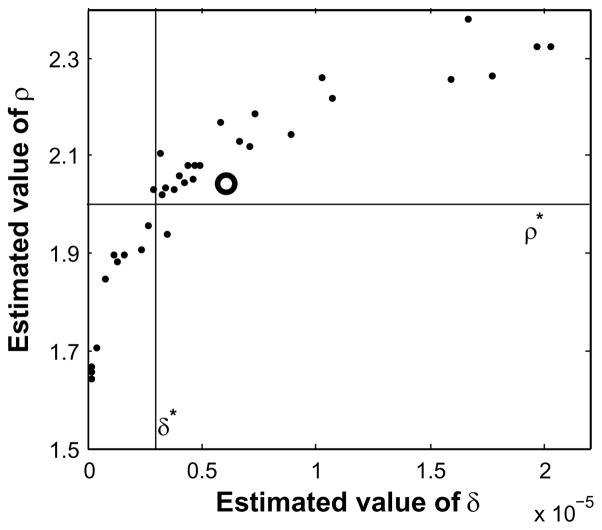
Fig. 5.
Scatter diagrams of 34 pairs of estimates of the epidemic parameters using Method 1 for a single target epidemic with δ* = 3×10⁻⁶ and ρ* = 2. Each pair of estimates used the data for one of the 109 days of the epidemic. The white circle identifies the mean of the 34 estimates: δmean = 6.03×10⁻⁶ and ρmean = 2.4.

