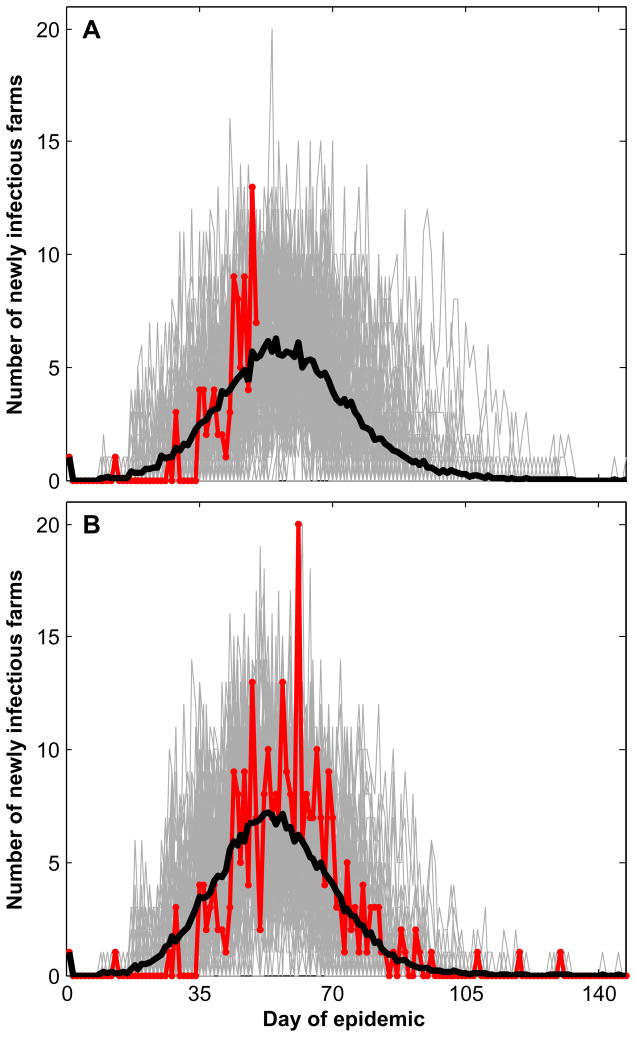
Fig. 6.
(A) The actual daily number of exposed farms of a target epidemic up to day 50 is shown in red. The estimated daily number based on this 50-day data set is shown by the black curve, which is the daily mean of the 100 simulated curves shown in gray. (B) The actual daily number of exposed farms for the complete epidemic of 147 days is shown In red. The estimated daily number based on this 147-day data set is shown by the black curve, which is the daily mean of the 100 simulated curves shown in gray.

