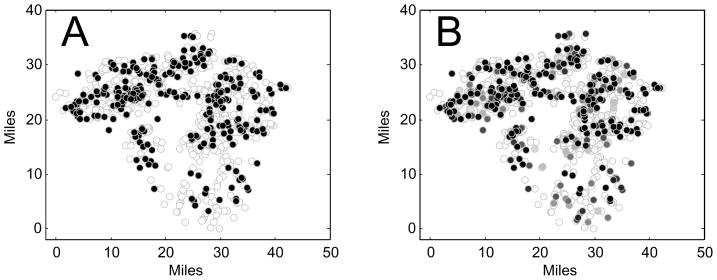
Fig. 7.
(A) The farms that were infected in a target epidemic are in black and those not infected are in white. (B) Each farm is colored a shade of gray according to its probability of being infected. The two epidemic parameters used are the ones that minimize the error function in Eq. (7).

