
Figure 1.
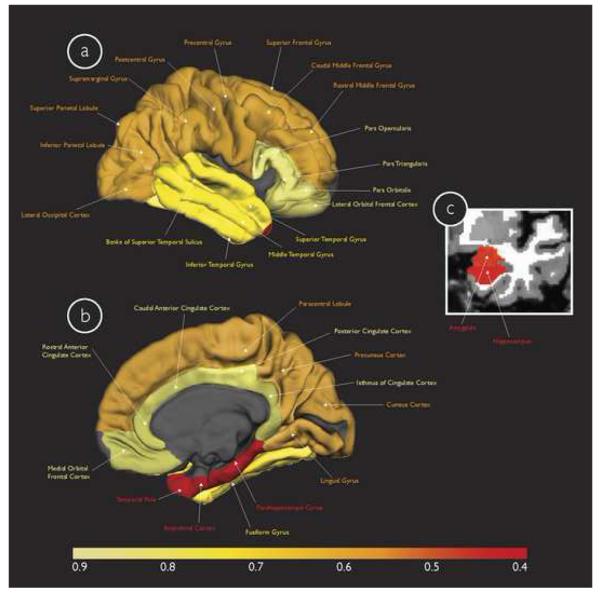
Multivariate Cox model results for the four neuroanatomic factors derived from the training cohort displayed on the gray matter surface (only one hemisphere is shown) in (a) lateral and (b) medial views, and (c) in the coronal view of a T1-weighted MRI image. These factors include the 1) medial temporal factor (individual ROIs illustrated in red), 2) fronto-parietoccipital factor (individual ROIs illustrated in orange), 3) lateral temporal factor (individual ROIs illustrated in bright yellow), and 4) fronto-cingulate factor (individual ROIs illustrated in faded yellow). The color scale at the bottom illustrates the magnitude of risk (hazard ratio) associated with progressing from MCI to AD, with faded yellow indicating regions with the lowest risk and red indicating regions with the highest risk (please see text for specific hazard ratios for each of the factors).