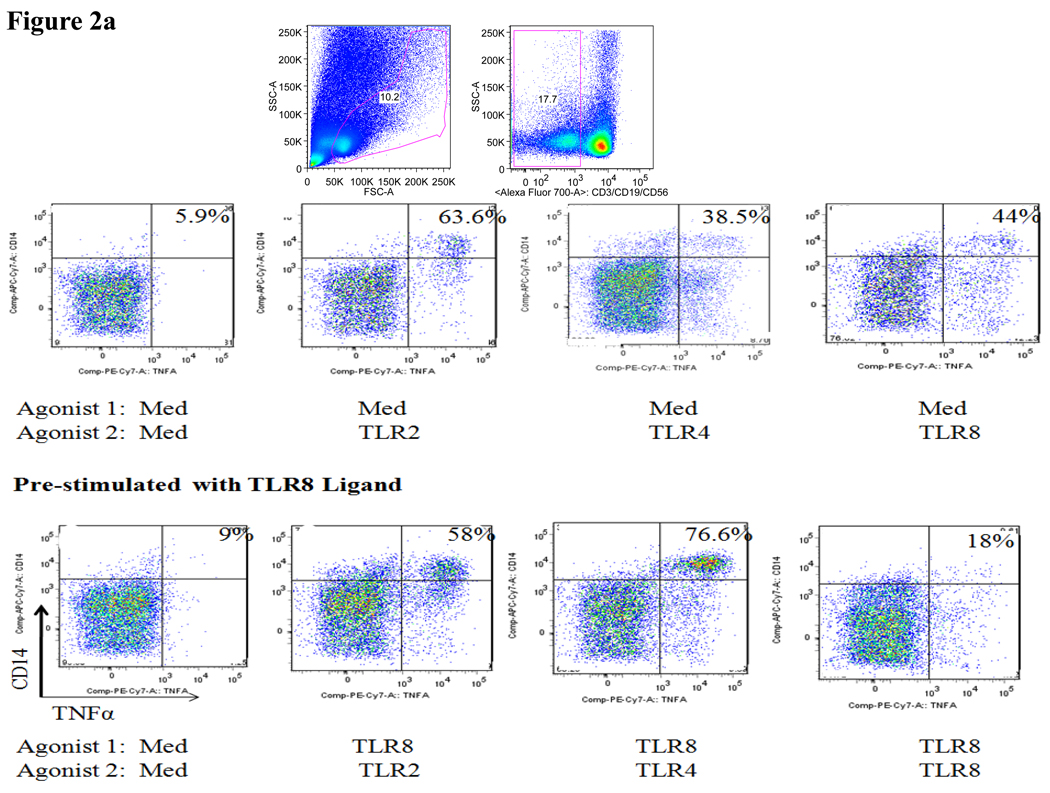
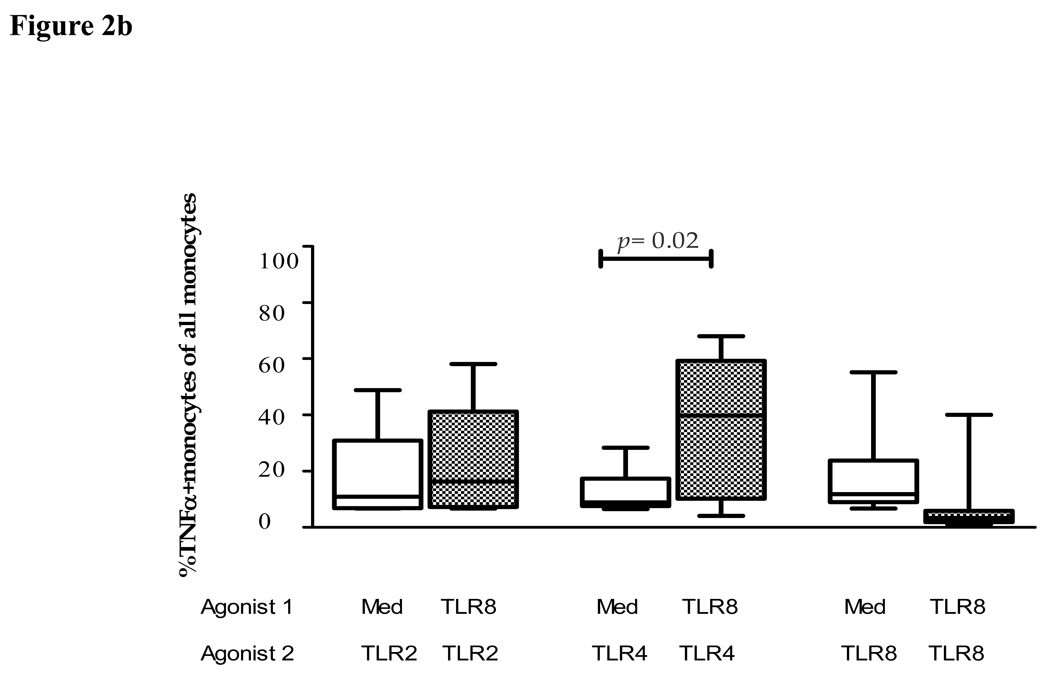
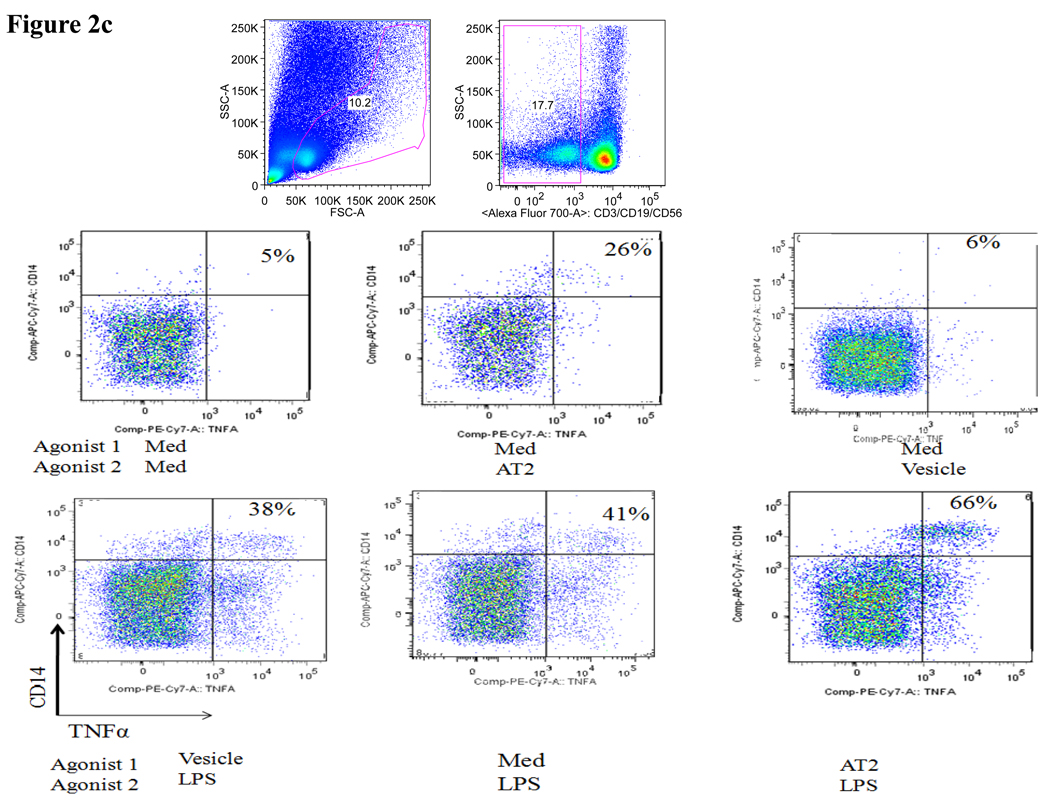
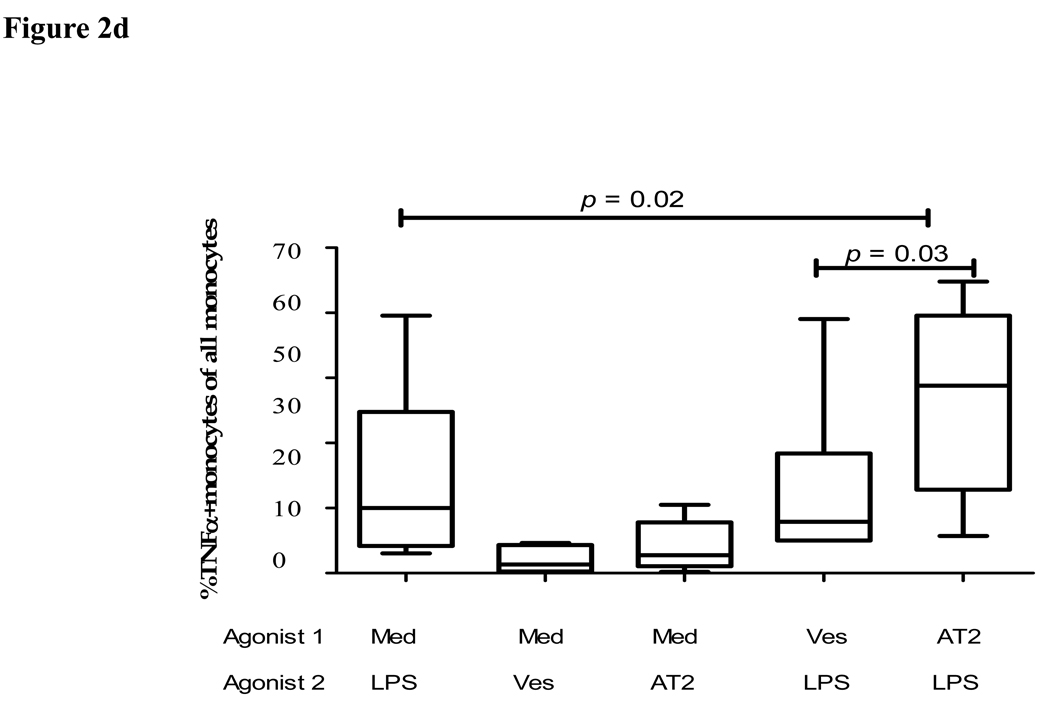
Figure 2. Impact of pre-exposure to TLR8 ligands on cytokine response of primary monocytes to TLR2 and TLR4 ligands.
(a) Representative flow cytometry plots show the percentage TNFα+ monocytes (upper right quadrant) in response to the respective TLR agonists following prestimulation with medium alone (top) or following prestimulation with the TLR8 agonist CL075 (0.5µg/ml TLR8-CL075, bottom).
(b) The figure shows the percentage of TNFα+CD14+ monocytes in 10 study subjects in response to the respective TLR agonists following prestimulation with medium alone (clear bars) or following prestimulation with the TLR8 agonist CL075 (0.5µg/ml TLR8-CL075, shaded bars). Vertical boxes represent 25th to 75th percentiles with median values delineated with a horizontal bar.
(c) Representative flow cytometry plots show the percentage TNFα+ monocytes (upper right quadrant) in response to LPS, AT-2 virus and its control vesicle following pre-stimulation with medium alone (top) or following pre-stimulation with the AT-2 virus or control vesicle (bottom).
(d) The figure shows the percentage of TNFα+CD14+ monocytes in 10 study subjects in response to LPS, AT-2 virus or vesicle control (agonist 2) following pre-stimulation with medium alone, or following prestimulation with the AT-2 virus or the vesicle control (agonist 1), as indicated. Vertical boxes represent 25th to 75th percentiles with median values delineated with a horizontal bar.


