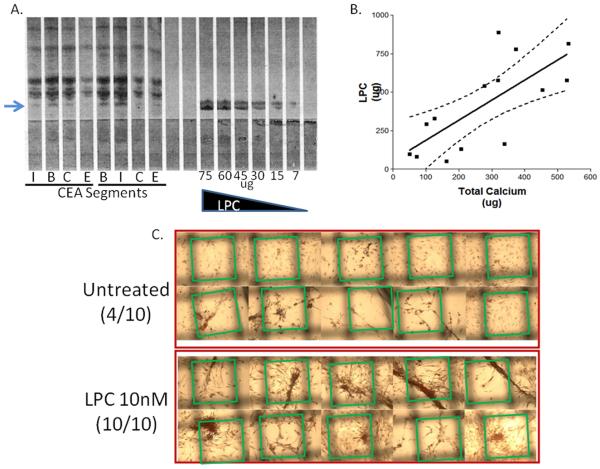
Figure 1. LPC correlates to CEA mineralization.
(A) LPC abundance in human CEA segments; I, internal; B, bifurcation; C, common; E, external. LPC (μg) used as standard curve. Arrow = LPC (B) LPC (μg) correlates to CEA total calcium (soluble calcium + pelleted calcification) (μg). Linear regression with 95% confidence lines. n=14 (C) LPC induces VSMC mineralizations in culture. Morphometric analysis of calcific ridges, Alizarin Red S stain. Green boxes outline the edges of the uniform grid used to score positive mineralizations.

