
Figure 2. VBM results.
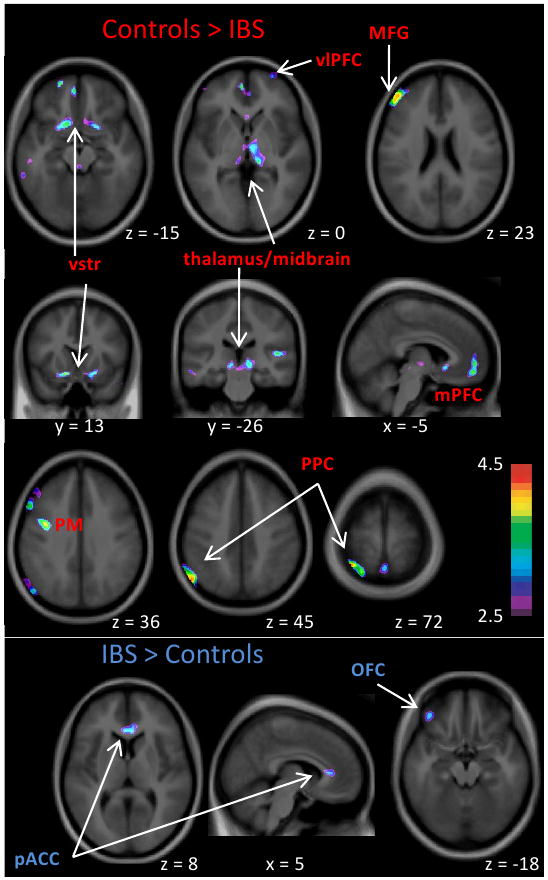
Significant GMD clusters from GLM comparing IBS and controls, with age as a covariate. Peak coordinates and correlations with behavioural variables are shown in Table 2. Results are displayed on a group average brain in stereotaxic (MNI) space. See table 2 for abbreviations. Colour bar shows t-value. Left side of image is left side of brain.