
Figure 4. GMD differences between pain predominant and non-pain predominant groups.
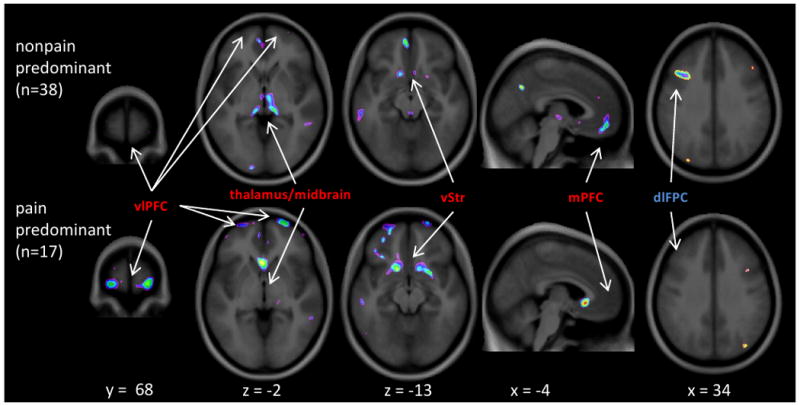
Examples of regions that differ between IBS subgroups based on most bothersome symptom (Pain, or Nonpain, which includes any other symptom). The clusters in red font are those that showed decreased GMD overall in IBS versus controls, whereas the blue is where IBS had increased GMD relative to controls. The figure clearly illustrates that the pain predominant group contributed the vlPFC and ventral striatum differences, while the non-pain predominant group contributed the differences in the thalamus/midbrain, mPFC, and dlPFC. The image is thresholded the same way as figures 2 and 3 (i.e. t>2.5 up to t=4.5). No masking has been applied to the images (i.e. whole brain results shown).