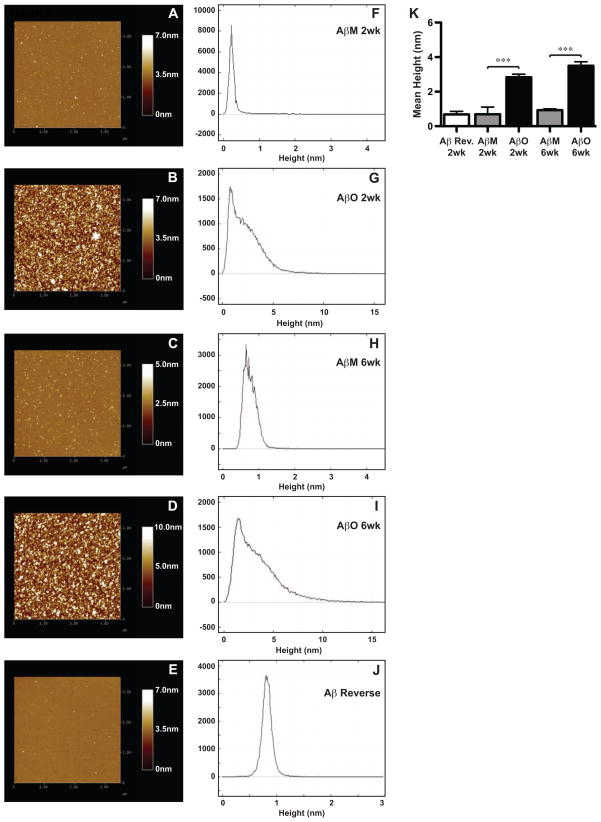
Figure 3. AβO preparations analyzed by atomic force microscopy.
Aβ reverse peptide, AβO, and AβM preparations were aged for 2 and 6 weeks and subsequently analyzed by atomic force microscopy (AFM). (A–E) Representative micrographs were acquired over a 3.5-μm2 area. Colors depicting height or total z-range are shown on individual scales. (F-J) Section analysis was performed to determine the relative abundance of heights of different Aβ entities present in a micrograph and represented as a frequency distribution. (K) The mean height was collected across multiple atomic force micrographs for each condition and graphed. A one-way ANOVA (p<0.0001) with Bonferroni’s post-test was performed (“***” p<0.001).

