Abstract
The effects of different doses of tramadol on analgesia and electroencephalographic (EEG) spectral parameters were compared in rats. Saline or tramadol 5, 10, 20 or 40 mg/kg was administered. The degree of analgesia was evaluated by tail-flick latency, and the degree of seizure was measured using numerical seizure score (NSS). Additionally, band powers, median power frequency and spectral edge frequency 95 were measured to quantify the EEG response. All doses of tramadol produced spike-wave discharge. Tramadol significantly and dose-dependently increased the analgesia, but these effects did not correspond with the changes in the EEG spectral parameters. NSS significantly increased in the Tramadol 20 and 40 mg/kg treatment groups compared to the Control and TRA5 groups, and two rats given 40 mg/kg had convulsions. In conclusion, tramadol dose-dependently increased the analgesic effect, and the 10 mg/kg dose appears to be a reliable clinical dose for analgesia in rats, but dose-dependent increases in analgesia and seizure severity did not correlate with EEG spectral parameters.
Keywords: EEG, Spectrum, Analgesia, Seizure, Tramadol, Rat
INTRODUCTION
Tramadol is a synthetic opioid drug that has a dual mechanism of analgesic action as a serotonin and norepinephrine reuptake inhibitor and a mu-opioid receptor agonist [1,2]. Formation of metabolite M1 is important for the analgesic effect of tramadol [3,4].
In human and animal clinical treatment, tramadol has a relatively lower incidence of addiction and is considered a safe analgesic for the treatment of moderate to severe pain [2,5-8]. In addition, tramadol is also used to reduce the anaesthetic requirements [9,10]. However, the pharmacokinetics of tramadol and M1 production in dogs were known to differ, and re-evaluation of dosage and analgesia was therefore needed [2,11,12].
Even though tramadol has relatively low side effects, two significant adverse reactions can occur with tramadol: seizures and serotonin syndrome [5,13-15]. These events are related to the inhibition of serotonin and norepinephrine reuptake by tramadol and/or its opioid effects [16] and may develop during monotherapy at recommended or excessive doses in animals and humans [13,14].
The electroencephalographic (EEG) changes by tramadol have been investigated in dogs and humans [17,18], but only in the anaesthetized state. As far as we know, there has been no report about the effects of different doses of tramadol on EEG, although tramadol has proconvulsive effects. The purpose of this study was to compare the effects of different doses of tramadol on the analgesic effect and the spectral EEG parameters in the frontal cortex (FC) and the parietal cortex (PC) in rats, as the prominent EEG pattern differs according to the cortical region [19-21].
METHODS
Experimental animals
Sixty adult male Sprague-Dawley rats (Samtaco, Osan, Korea) weighing 320~450 g were used. Each two animals were housed together in a Plexiglas cage (28 cmW×42 cmD×18 cmH) and were maintained in a controlled environment throughout the study: 22~24℃ ambient temperature, 12:12-hour light-dark cycle (lights on from 7:00 to 19:00), with a commercial food and tap water available ad libitum except on the day of the experiment. The rats were sacrificed by an overdose of CO2 inhalation after the completion of the experiment. Kyungpook National University Institutional Animal Care and Use Committee approved the study, and experiments were carried out in accordance with the National Institutes of Health Guidelines for the Care and Use of Laboratory Animals (1996).
Drugs
Tramadol (Toranzin, Samsung Pharm. Ind. Co., LTD., Seoul, Korea) and normal saline were purchased as commercial products. Tramadol was freshly diluted with normal saline immediately before dosing, and the administration volume was 1.0 ml/kg. All drugs were administered intraperitoneally in the present study, unless otherwise stated.
Experimental procedures
This study comprised two experiments; the first experiment was designed to evaluate the analgesic effects of tramadol at various doses, and second experiment was designed to evaluate the effects of tramadol on EEG.
In the first experiment, the rats were randomly divided into five groups (n=6 for each group) according to drug: normal saline 1.0 ml/kg ('Control' group), tramadol 5, 10, 20 or 40 ml/kg treatment ('TRA5', 'TRA10', 'TRA20' and 'TRA40' groups, respectively). On the day of experiment, the rats were allowed to acclimate for >1 hour in a Plexiglas cage in the experimental room. At least thirty minutes before the baseline measurements, tail-flick latency (TFL) tests were performed using warm water (40℃) [22,23] for the evaluation of warm allodynia, and the rats showing a 30-second cut-off value were included in further studies. Baseline TFL was measured three times at a 30-minute interval. Baseline value measurement was completed by twelve o'clock. Drug treatments were always administered between 14:00 and 14:15 to minimize any errors introduced by circadian rhythm. Post-drug TFL and visual seizure score were measured at 30, 60, 90, 120, 180, and 240 minutes after drug treatment.
In the second experiment, the rats were randomly assigned to five groups (n=6 for each group) according to drug treatment: normal saline 1.0 ml/kg ('Control' group), tramadol 5, 10, 20 or 40 ml/kg treatment ('TRA5', 'TRA10', 'TRA20' and 'TRA40' groups, respectively). Surgery and EEG recording methods were similar to those in a previous study [24]. In brief, at least 7 days before starting the experiments, epidural screw electrodes (tip diameter 1.0 mm) for EEG recording were implanted under ketamine (60 mg/kg) and medetomidine (0.4 mg/kg) anesthesia. After the rats showed no purposeful movement in response to a strong tail-pinch, the rats were placed in a stereotaxic apparatus. The midline scalp was locally anesthetized with 2% lidocaine, incised, and then the periosteum and the skull surface were cleaned. Six small holes were drilled bilaterally into the frontal bone (3.5 mm anterior and 1.25 mm from bregma), parietal bone (5 mm posterior and 2.5 mm from bregma), and the interparietal bone over the cerebellum (10 mm posterior and 2.0 mm from bregma) without perforating the dura mater using a low-speed burr (ball diameter 0.8 mm) and a surgical microscope. Four gold-layered stainless steel screws for EEG recording were inserted into the frontal and parietal cortices (FC and PC, respectively). Two screws over the cerebellum served as reference and ground electrodes. The electrodes with connecting pins were arranged together in 3×2 matrices and fixed over the skull with dental acrylic. Butorphanol (2.0 mg/kg, b.i.d., Butophan inj., Myungmoon Pharma Co., Ltd., Seoul, Korea) was administered for 2 days to alleviate pain during the recovery. On the day of the experiment, two rats were habituated to a recording box for 2 hours, and the rats were allowed free movement using a tether and a swivel system. The ambient temperature in the recording box was maintained at 22±1℃. Drug treatments were completed within 2 minutes for each rat. EEG signals were recorded continuously throughout the experiment. The 4-channel EEG signals over the frontal and parietal cortices were recorded monopolarly with respect to the reference electrode. The connecting pins were attached via a tether and swivel arrangement to a bioelectric amplifier (CyberAmp 380; Axon instruments Inc., Foster City, CA, USA). The EEG signals were amplified 10,000× and filtered at a range of 1 to 60 Hz. The signals were saved to a personal computer by an AD converter (DigiData 1200A; Axon instruments Inc.) at a sampling rate of 600 Hz.
The degree of analgesia
Thermal antinociception was assessed using tail-flick latency (TFL). The method was similar to that used in a previous report [25]. In brief, the thermal stimulus comprised immersion of one- to two-thirds of the tail in a 50℃ water bath. The immersed tail length was alternatively changed to avoid sensitization or adaptation. During testing, the rats were loosely wrapped in a towel and were gently restrained by the experimenter. Only tail flicking was admitted as a positive response, and the latency to tail-flick response was measured by a stopwatch. The cut-off time was 15 seconds to minimize tissue damage. After each measurement, the tail was dried with a paper towel. TFLs are expressed as a percentage of maximal possible effect (%MPE), which was calculated from the following formula:
The degree of seizure
Numerical seizure score (NSS) was used. Seizure activity and severity was visually scored using a modified Racine scale [26] from 0 to 5 as follows: 0, no response; 1, wet-dog shake/or behavioral arrest; 2, wet-dog shake, staring, pawing, clonic jerks; 3, bilateral forelimb clonus with rearing, falling; 4, continuous grade 3 seizures for >30 minutes; and 5, death.
EEG spectral parameters
The raw EEG signal was visually inspected prior to analysis, and epochs (10-second) with artifacts were removed by a self-made program. Artifact-free 30-minute EEG signals at 30 (from immediately after drug injection to 30 minute), 60 (30~60 minute), 90 (60~90 minute), 120 (90~120 minute), 180 (150~180 minute), and 240 (210~240 minute) minutes after saline or tramadol administration were used to quantify the EEG. The Hanning-windowed 2.5-second epochs (1.25-second overlap) were converted to power spectra using a fast Fourier transform algorithm and then averaged to power spectra.
Relative band powers
Power spectra were cut into nine frequency bands: delta1, 1~2.5 Hz; delta2, 2.5~4.0; theta1, 4~6; theta2, 6~8; alpha, 8~13; beta1, 13~21; beta2, 21~32; gamma, 32~50; and total, 1~50 Hz. Then, the relative band powers were calculated by each band power percentage to total power at each recording period.
Median power frequency (MPF) and spectral edge frequency 95 (SEF95)
The frequencies below 50% and 95% of the total power were calculated.
The number of spike-wave discharges (SWD)
The number of spike-wave patterns on EEG was counted on each cortex. A spike-wave discharge train was counted as one.
Statistical analysis
All data were expressed as mean±SD. Variables of tail-flick latency, the degree of seizure, relative band power, MPF and SEF95 were analyzed by two-factor repeated-measures ANOVA with time and treatment, and a Bonferroni test was used to analyze variables for time between groups (SPSS 14.0K; Datasolution, Seoul, Korea). The number of SWD was analyzed by a Kruskal-Wallis H test followed by a Mann-Whitney test. If the p value was less than 0.05, it was considered statistically significant in two-factor repeated measures. In addition, p<0.05 in a Kruskal-Wallis test or p<0.01 in a Mann-Whitney test was considered statistically significant.
RESULTS
In the second experiment, 2 rats in the TRA40 group had convulsive seizures; however, this was not observed in the first experiment for assessing the degree of analgesia and seizure. Additionally, zero mortality was observed in all doses of tramadol treatment.
The degree of analgesia
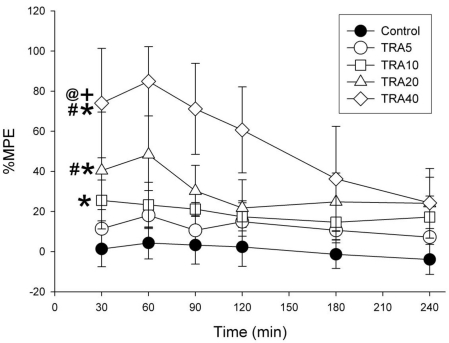
Repeated-measures ANOVA revealed that treatment (F=39.8, p<0.001), time course (F=9.9, p<0.001) and interaction (F=2.6, p<0.01) were significant (Fig. 1). The Bonferroni test indicated a dose-dependent significant increase of %MPE; all treatments, except TRA5 (p=0.329), significantly increased %MPE (p<0.01 at TRA10, p<0.001 at TRA20 and TRA40) compared to Control group. When compared to the TRA5 group, variables in the TRA20 and TRA40 groups significantly increased (p<0.01 and p< 0.001, respectively). Additionally, variables in the TRA40 group significantly increased when compared to the TRA10 and TRA20 groups (p<0.001, both of them).
Fig. 1.
Time course of analgesic effects in rats treated with tramadol. The rats (n=6) were intraperitoneally administered saline, and tramadol 5, 10, 20 and 40 mg/kg, respectively (group 'Control', 'TRA5', 'TRA10', 'TRA20' and 'TRA40'). Analgesic effects were evaluated with 50℃ hot-water tail-flick latency, and were expressed as a percentage of maximal possible effect (%MPE). Data were expressed as mean±S.D. Data were analyzed by two factor repeated measures ANOVA with time and treatment, and a Bonferroni test was used to analyze variables for time between groups. *p<0.05 when compared to Control group, #p<0.05 when compared to TRA5 group, +p<0.05 when compared to TRA10 group, and @p<0.05 when compared to TRA20 group.
The degree of seizure
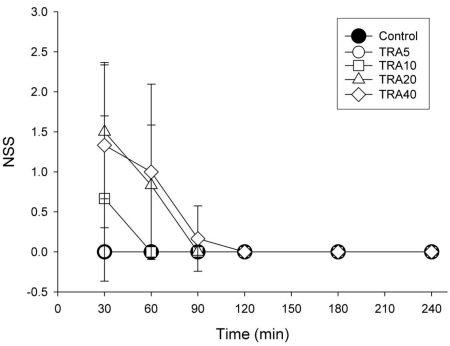
Control and TRA5 treatment did not result in seizure-like activity during any recording times, and no rats exhibited convulsions at any dose of tramadol. Staring and behavioral arrest with dull or no concern about environmental stimuli were common. Repeated-measures ANOVA revealed that treatment (F=5.9, p<0.01), time course (F=18.2, p<0.001) and interaction (F=4.4, p<0.001) were significant (Fig. 2). Bonferroni test showed that tramadol 20 and 40 mg/kg treatments significantly increased NSS (p<0.05) compared to Control and TRA5 groups.
Fig. 2.
Time course of degree of seizure in rats treated with tramadol. The rats (n=6) were intraperitoneally administered saline, and tramadol 5, 10, 20 and 40 mg/kg, respectively (group 'Control', 'TRA5', 'TRA10', 'TRA20' and 'TRA40'). The degree of seizure were evaluated with numerical seizure score (NSS), a modified Racine scale, from 0 to 5 as follows: 0, no response; 1, wet-dog shake/or behavioral arrest; 2, wet-dog shake, staring, pawing, clonic jerks; 3, bilateral forelimb clonus with rearing falling; 4, continuous grade 3 seizures for >30 min; and 5, death. Data were expressed as mean±S.D. Data were analyzed by two factor repeated measures ANOVA with time and treatment, and a Bonferroni test was used to analyze variables for time between groups. Statistical results were not marked in figure, but were described in text.
Relative band powers
Variables in frontal cortex (FC) changed more significantly with different drug treatment than those in the parietal cortex (PC)
FC
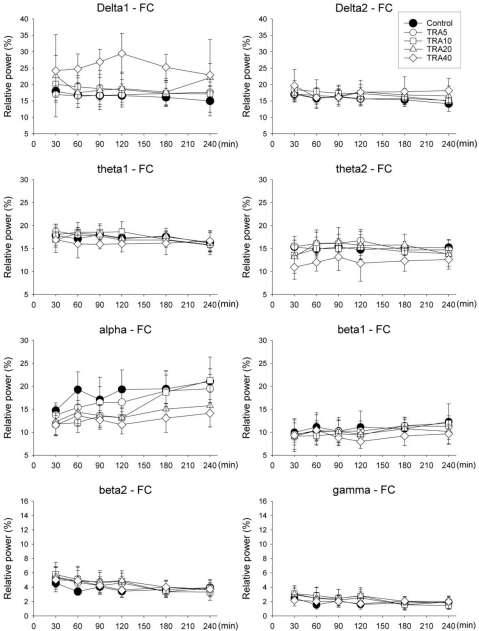
Delta1, theta2 and alpha bands showed significant changes with different doses of tramadol (F=7.4, p<0.001 at delta1; F=3.0, p<0.05 at theta2 and F=5.2, p<0.01 at alpha) (Fig. 3). Delta1 power in the TRA40 group changed significantly compared to all other groups (p<0.001 vs. Control and TRA5 groups, p<0.05 vs. TRA10 group and p=0.036 at TRA20 group). Theta2 powers of TRA5 and TRA40 were significantly different (p<0.05). Alpha powers in the TRA20 and TRA40 groups were significantly different compared to those in the Control group (p<0.05 and p<0.01, respectively).
Fig. 3.
Relative band powers on the medial prefrontal cortex (FC) in rats treated with tramadol. The rats (n=6) were intraperitoneally administered saline, and tramadol 5, 10, 20 and 40 mg/kg, respectively (group 'Control', 'TRA5', 'TRA10', 'TRA20' and 'TRA40'). Data were expressed as mean±S.D. Data were analyzed by two factor repeated measures ANOVA with time and treatment, and a Bonferroni test was used to analyze variables for time between groups. Statistical results were not marked in figure, but were described in text.
PC
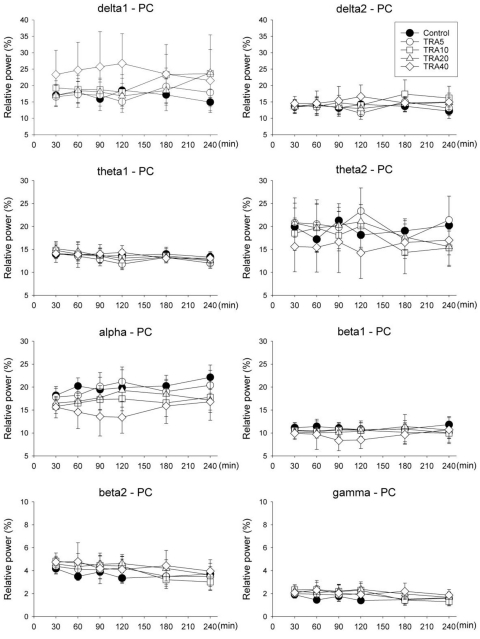
Only delta1 power showed significant changes by drug treatment in repeated-measures ANOVA (F=2.8, p<0.05) but no significance in Bonferroni test (Fig. 4).
Fig. 4.
Relative band powers on the parietal cortex (PC) in rats treated with tramadol. The rats (n=6) were intraperitoneally administered saline, and tramadol 5, 10, 20 and 40 mg/kg, respectively (group 'Control', 'TRA5', 'TRA10', 'TRA20' and 'TRA40'). Data were expressed as mean±S.D. Data were analyzed by two factor repeated measures ANOVA with time and treatment, and a Bonferroni test was used to analyze variables for time between groups. Only delta1 power showed significant changes by drug treatment in repeated measures ANOVA (F=2.8, p=0.046) but no significance in Bonferroni test.
MPF and SEF95
FC (Fig. 5)
Fig. 5.
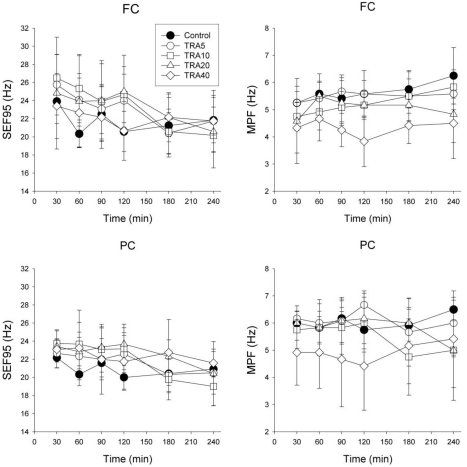
Electroencephalographic spectral parameters on the medial prefrontal cortex (FC) and the parietal cortex (PC) in rats treated with tramadol. The rats (n=6) were intraperitoneally administered saline, and tramadol 5, 10, 20 and 40 mg/kg, respectively (group 'Control', 'TRA5', 'TRA10', 'TRA20' and 'TRA40'). The changes of spectral edge frequency 95 (SEF95) and median power frequency (MPF) between groups were not significant, except in MPF of FC. Data were expressed as mean±S.D. Data were analyzed by two factor repeated measures ANOVA with time and treatment, and a Bonferroni test was used to analyze variables for time between groups. Statistical results were not marked in figure, but were described in text.
Repeated measures ANOVA revealed that time (F=4.6, p<0.01), interaction (F=1.8, p<0.05) and treatment (F=3.8, p<0.05) were significant, and the Bonferroni test showed that the TRA40 group was significantly changed compared to Control and TRA5 groups (p<0.05). In SEF95, time (F=8.9, p<0.001) was significant, but interaction (F= 1.5, p=0.090) and drug treatment (F=0.7, p=0.604) were not significant.
PC (Fig. 5)
Repeated measures ANOVA revealed that interaction (F=1.9, p<0.05) was significant, but time (F=0.8, p=0.569) and treatment (F=2.3, p=0.090) were not significant. In SEF95, time (F=9.5, p<0.001) and interaction (F=1.9, p<0.05) were significant, but drug treatment (F=1.0, p=0.432) was not significant.
The number of SWD
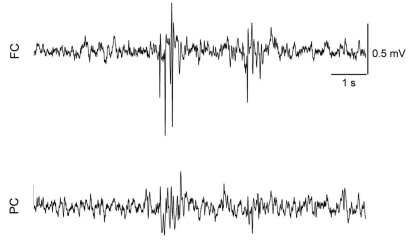
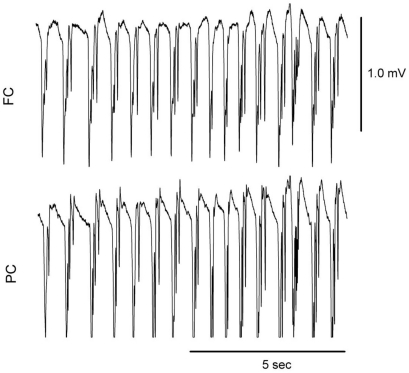
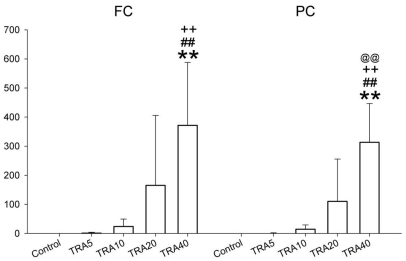
SWD appeared in almost all doses of tramadol (Fig. 6), and 2 rats in the TRA40 group had convulsive seizures (Fig. 7). The number of SWD in both FC and PC were significantly increased by treatment [χ2(4)=24.206, p<0.001 in both cortices] (Fig. 8). In FC, the number of SWD in the TRA40 group was significantly increased when compared to the Control, TRA5 and TRA10 groups (p<0.01). In PC, the number of SWD in the TRA40 group was significantly increased compared to that in the other groups (p<0.01). The number of SWD in FC appeared to be higher than that in PC, but the differences between FC and PC in all groups were not significant (p=0.363 in TRA5, p=0.092 in TRA10, p=0.194 in TRA20 and p=0.056 in TRA40, respectively, by Student's t-test).
Fig. 6.
Raw electroencephalographic (EEG) spike-wave discharge (SWD) pattern in the medial prefrontal cortex (FC) and the parietal cortex (PC) corresponding with brief and phase movement in rats treated with intraperitoneal tramadol 40 mg/kg. The movement was evaluated with self-made movement-sensing-board, using a vibration sensor and acrylic board. The board was placed under the cage, and was used just for detecting twitching and convulsion. The raw EEG on the FC presented more discrete SWD pattern than on the PC.
Fig. 7.
Raw electroencephalographic (EEG) spike-wave discharge (SWD) pattern in the medial prefrontal cortex (FC) and the parietal cortex (PC) corresponding with convulsive seizure in rats treated with intraperitoneal tramadol 40 mg/kg. Two rats treated with tramadol dose at 40 mg/kg showed convulsive seizures in the experiment 2.
Fig. 8.
The number of spike-wave discharge on the medial prefrontal cortex (FC) and the parietal cortex (PC) in rats treated with tramadol. The rats (n=6) were intraperitoneally administered saline, and tramadol 5, 10, 20 and 40 mg/kg, respectively (group 'Control', 'TRA5', 'TRA10', 'TRA20' and 'TRA40'). Data were expressed as mean±S.D. Data were analyzed by a Kruskal-Wallis H test followed by a Mann-Whitney test. **p<0.01 when compared to Control group, ##p<0.01 when compared to TRA5 group, ++p<0.01 when compared to TRA10 group, and @@p<0.01 when compared to TRA20 group.
DISCUSSION
The present results show that 1) tramadol significantly increased the analgesic effect in a dose-dependent manner, but not at 5 mg/kg, 2) relatively higher doses of tramadol (20 and 40 mg/kg) significantly increased NSS, 3) all doses of tramadol may evoke absent seizure, as determined by SWD in EEG, 4) tramadol at 40 mg/kg can evoke a convulsive seizure, and 5) tramadol's effects on EEG spectral parameters are less confirmative than the increasing dose-related analgesia and behavioral changes.
Tramadol is a centrally acting drug and will induce seizure-like activity. In the present study, we evaluated the dose-related analgesia and behavior-related EEG aspects. We found that tramadol dose-dependently increased the analgesic effect, but 5 mg/kg tramadol did not induce a significant analgesic effect. The present results were similar to the previous results [1], which demonstrated that 10 and 20 mg/kg tramadol, but not 5 mg/kg tramadol, significantly increased the analgesic effects in mono-arthritic rats.
Tramadol-related seizures are prone to develop at higher dose of tramadol [13] and because of the faster absorption rate by I.V. administration of tramadol [27]. In the present study, although significant elevation of NSS was observed, the degree of seizure was not much higher than expected, and no convulsive seizure and no more than score 2 was observed, even at 40 mg/kg tramadol in the first experiment. Previous results were similar with the present results, in that tramadol 30 mg/kg did not induce myoclonic activity and convulsion [13]. Instead, (-)-enantiomer of tramadol at 10 or 20 mg/kg resulted in myoclonic seizure activity in some nonkindled rats. In the present study, although the severity and frequency were different between groups, seizure-like activity, behavioral arrest and staring occurred at most doses of tramadol, and intermittent SWD were also observed at all doses of tramadol (n=2 at TRA5, n=5 at TRA10, n=6 at TRA20 and TRA40 groups). SWD did not last more than 1 second. In the present study, myoclonic seizure activity was not observed in NSS evaluation, although SWD were present in EEG records. Absent seizure is characterized by spontaneous spike-wave discharges in EEG and concomitant behavioral signs (behavioral arrest and twitching of vibrissae, facial myoclonic jerk, accelerated breathing, head tilting) [21]. SWD is strongly related with absent seizure in rats and humans. In the present study, SWD occurrences often coincided with periods of behavioral arrest and staring and were more frequent at higher doses, but were not always observed during those episodes. That is, although SWD did not induce the behavioral signs of tramadol, tramadol may aggravate the absent seizure in a dose-dependent manner.
Convulsive seizure by higher dose of tramadol is likely affected by environmental factors such as stress. No rats had convulsion seizures in the first experiment; however, 2 rats treated with 40 mg/kg tramadol had convulsive seizures in the second experiment. In the second experiment, as we stated, the rats underwent surgical management for EEG recordings and a connection with tether recording system, although they had adequate recovery and acclimation time. These experimental conditions were likely stressors that provoked convulsive seizures. In some respects, this observation is similar to the proconvulsant effects of tramadol in the kindled rats [13].
Previous study documented the mild dose-related sedation of tramadol in dogs [12]. Although sedation was not evaluated in the present study, sedation-like signs were not observed, and based on the EEG, the clinical signs were rather close to seizure-like symptoms, because there were SWD and rare prominent delta-wave patterns during staring and/or behavioral arrest.
In the present study, only MPF in FC with tramadol 40 mg/kg decreased significantly compared to those with saline and 5 mg/kg of tramadol. Previous results showed that EEG spectral analysis and MPF were useful methods for assessing manifestation of analgesia in various species [28-32]. Jang et al. (2009) also found that SEF95 showed a strong correlation with the depth of anesthesia in rats. In contrast, other results insisted that spectral EEG parameters were not precise determinants to predict the level of anesthesia [24,33,34]. Prior to EEG evaluation, we considered that the central effects of tramadol, i.e., dose-dependent analgesia and seizure severity, significantly affected the EEG spectral parameters, especially on MPF or some low frequency band powers. However, the present results showed significant change in MPF in FC, but only at the highest dose. That is, with doses that resulted in a significant increase of %MPE without severe convulsion, i.e., 10~20 mg/kg of tramadol, MPF and SEF95 did change significantly compared to Control. Therefore, increase of analgesia by tramadol does not appear to be related with decrease of MPF. Band powers also provided a similar statistical pattern of change as MPF. That is, although some bands produced significant changes, these appeared only when compared to the TRA40 group. Taken together, spectral EEG response may not closely correlate with the degree of analgesia and seizure by tramadol.
Upon further data inspection, the number of SWD was greater in FC than in PC, and the appearance of SWD in FC was also more apparent. Previous results demonstrated that SWD was more prominent in the frontal cortex region [19,20], but significant differences between the cortices were not observed in the present study.
In conclusion, tramadol dose-dependently increased the analgesic effect, and the 10 mg/kg dose is a reliable clinical dose for analgesia in rats. Additionally, tramadol administration presented SWD on the EEG, which may be related with absent seizure. However, dose-dependent increases of analgesia and seizure severity are not closely correlated with EEG spectral parameters.
ACKNOWLEDGEMENTS
This work was supported by the Korea Research Foundation Grant funded by the Korean Government (KRF-2008-313-H00015) and by BK21 Project.
ABBREVIATIONS
- EEG
electroencephalogram
- TFL
tail-flick latency
- NSS
numerical seizure score
- %MPE
a percentage of maximal possible effect
- MPF
median power frequency
- SEF95
spectral edge frequency 95
- SWD
spike-wave discharge.
References
- 1.Xie H, Dong ZQ, Ma F, Bauer WR, Wang X, Wu GC. Involvement of serotonin 2A receptors in the analgesic effect of tramadol in mono-arthritic rats. Brain Res. 2008;1210:76–83. doi: 10.1016/j.brainres.2008.02.049. [DOI] [PubMed] [Google Scholar]
- 2.Giorgi M, Del Carlo S, Saccomanni G, Lebkowska-Wieruszewska B, Turini V, Kowalski C. Biopharmaceutical profile of tramadol in the dog. Vet Res Commun. 2009;33(Suppl 1):189–192. doi: 10.1007/s11259-009-9278-4. [DOI] [PubMed] [Google Scholar]
- 3.Poulsen L, Arendt-Nielsen L, Brosen K, Sindrup SH. The hypoalgesic effect of tramadol in relation to CYP2D6. Clin Pharmacol Ther. 1996;60:636–644. doi: 10.1016/S0009-9236(96)90211-8. [DOI] [PubMed] [Google Scholar]
- 4.Ide S, Minami M, Ishihara K, Uhl GR, Sora I, Ikeda K. Mu opioid receptor-dependent and independent components in effects of tramadol. Neuropharmacology. 2006;51:651–658. doi: 10.1016/j.neuropharm.2006.05.008. [DOI] [PubMed] [Google Scholar]
- 5.Sansone RA, Sansone LA. Tramadol: seizures, serotonin syndrome, and coadministered antidepressants. Psychiatry (Edgmont) 2009;6:17–21. [PMC free article] [PubMed] [Google Scholar]
- 6.Pypendop BH, Ilkiw JE. Pharmacokinetics of tramadol, and its metabolite O-desmethyl-tramadol, in cats. J Vet Pharmacol Ther. 2008;31:52–59. doi: 10.1111/j.1365-2885.2007.00921.x. [DOI] [PubMed] [Google Scholar]
- 7.Shilo Y, Britzi M, Eytan B, Lifschitz T, Soback S, Steinman A. Pharmacokinetics of tramadol in horses after intravenous, intramuscular and oral administration. J Vet Pharmacol Ther. 2008;31:60–65. doi: 10.1111/j.1365-2885.2007.00929.x. [DOI] [PubMed] [Google Scholar]
- 8.Kongara K, Chambers P, Johnson CB. Glomerular filtration rate after tramadol, parecoxib and pindolol following anaesthesia and analgesia in comparison with morphine in dogs. Vet Anaesth Analg. 2009;36:86–94. doi: 10.1111/j.1467-2995.2008.00430.x. [DOI] [PubMed] [Google Scholar]
- 9.Seddighi MR, Egger CM, Rohrbach BW, Cox SK, Doherty TJ. Effects of tramadol on the minimum alveolar concentration of sevoflurane in dogs. Vet Anaesth Analg. 2009;36:334–340. doi: 10.1111/j.1467-2995.2009.00468.x. [DOI] [PubMed] [Google Scholar]
- 10.de Wolff MH, Leather HA, Wouters PF. Effects of tramadol on minimum alveolar concentration (MAC) of isoflurane in rats. Br J Anaesth. 1999;83:780–783. doi: 10.1093/bja/83.5.780. [DOI] [PubMed] [Google Scholar]
- 11.KuKanich B, Papich MG. Pharmacokinetics of tramadol and the metabolite O-desmethyltramadol in dogs. J Vet Pharmacol Ther. 2004;27:239–246. doi: 10.1111/j.1365-2885.2004.00578.x. [DOI] [PubMed] [Google Scholar]
- 12.McMillan CJ, Livingston A, Clark CR, Dowling PM, Taylor SM, Duke T, Terlinden R. Pharmacokinetics of intravenous tramadol in dogs. Can J Vet Res. 2008;72:325–331. [PMC free article] [PubMed] [Google Scholar]
- 13.Potschka H, Friderichs E, Loscher W. Anticonvulsant and proconvulsant effects of tramadol, its enantiomers and its M1 metabolite in the rat kindling model of epilepsy. Br J Pharmacol. 2000;131:203–212. doi: 10.1038/sj.bjp.0703562. [DOI] [PMC free article] [PubMed] [Google Scholar]
- 14.Kahn LH, Alderfer RJ, Graham DJ. Seizures reported with tramadol. Jama. 1997;278:1661. [PubMed] [Google Scholar]
- 15.Sen H, Ozkan S, Dagli G. Epileptic seizure during patient-controlled analgesia with tramadol. Eur J Anaesthesiol. 2009;26:447. doi: 10.1097/EJA.0b013e32831de521. [DOI] [PubMed] [Google Scholar]
- 16.Spiller HA, Gorman SE, Villalobos D, Benson BE, Ruskosky DR, Stancavage MM, Anderson DL. Prospective multicenter evaluation of tramadol exposure. J Toxicol Clin Toxicol. 1997;35:361–364. doi: 10.3109/15563659709043367. [DOI] [PubMed] [Google Scholar]
- 17.Kongara K, Chambers JP, Johnson CB. Electroencephalographic responses of tramadol, parecoxib and morphine to acute noxious electrical stimulation in anaesthetised dogs. Res Vet Sci. 2010;88:127–133. doi: 10.1016/j.rvsc.2009.05.012. [DOI] [PubMed] [Google Scholar]
- 18.Fodale V, Tescione M, Roscitano C, Pino G, Amato A, Santamaria LB. Effect of tramadol on Bispectral Index during intravenous anaesthesia with propofol and remifentanil. Anaesth Intensive Care. 2006;34:36–39. doi: 10.1177/0310057X0603400113. [DOI] [PubMed] [Google Scholar]
- 19.Terrier G, Gottesmann CL. Study of cortical spindles during sleep in the rat. Brain Res Bull. 1978;3:701–706. doi: 10.1016/0361-9230(78)90021-7. [DOI] [PubMed] [Google Scholar]
- 20.Midzianovskaia IS, Kuznetsova GD, Coenen AM, Spiridonov AM, van Luijtelaar EL. Electrophysiological and pharmacological characteristics of two types of spike-wave discharges in WAG/Rij rats. Brain Res. 2001;911:62–70. doi: 10.1016/s0006-8993(01)02705-6. [DOI] [PubMed] [Google Scholar]
- 21.Coenen AM, Van Luijtelaar EL. Genetic animal models for absence epilepsy: a review of the WAG/Rij strain of rats. Behav Genet. 2003;33:635–655. doi: 10.1023/a:1026179013847. [DOI] [PubMed] [Google Scholar]
- 22.Back SK, Won SY, Hong SK, Na HS. Gabapentin relieves mechanical, warm and cold allodynia in a rat model of peripheral neuropathy. Neurosci Lett. 2004;368:341–344. doi: 10.1016/j.neulet.2004.07.091. [DOI] [PubMed] [Google Scholar]
- 23.Park JH, Kim SK, Kim HN, Sun B, Koo S, Choi SM, Bae H, Min BI. Spinal cholinergic mechanism of the relieving effects of electroacupuncture on cold and warm allodynia in a rat model of neuropathic pain. J Physiol Sci. 2009;59:291–298. doi: 10.1007/s12576-009-0035-9. [DOI] [PMC free article] [PubMed] [Google Scholar]
- 24.Jang HS, Choi HS, Lee SH, Jang KH, Lee MG. Evaluation of the anaesthetic effects of medetomidine and ketamine in rats and their reversal with atipamezole. Vet Anaesth Analg. 2009;36:319–327. doi: 10.1111/j.1467-2995.2009.00463.x. [DOI] [PubMed] [Google Scholar]
- 25.Jang HS, Lee MG. Atipamezole changes the antinociceptive effects of butorphanol after medetomidine-ketamine anaesthesia in rats. Vet Anaesth Analg. 2009;36:591–596. doi: 10.1111/j.1467-2995.2009.00497.x. [DOI] [PubMed] [Google Scholar]
- 26.Koh S, Tibayan FD, Simpson JN, Jensen FE. NBQX or topiramate treatment after perinatal hypoxia-induced seizures prevents later increases in seizure-induced neuronal injury. Epilepsia. 2004;45:569–575. doi: 10.1111/j.0013-9580.2004.69103.x. [DOI] [PubMed] [Google Scholar]
- 27.Osterloh G, Friderichs E, Felgenhauer F, Gunzler WA, Henmi Z, Kitano T, Nakamura M, Hayashi H, Ishii I. General pharmacological studies on tramadol, a potent analgetic agent (author's transl) Arzneimittelforschung. 1978;28:135–151. [PubMed] [Google Scholar]
- 28.Short CE, Raiha JE, Raiha MP, Otto K. Comparison of neurologic responses to the use of medetomidine as a sole agent or preanesthetic in laboratory beagles. Acta Vet Scand. 1992;33:77–88. doi: 10.1186/BF03546938. [DOI] [PMC free article] [PubMed] [Google Scholar]
- 29.Otto KA, Voight S, Piepenbrock S, Deegen E, Short CE. Differences in quantitated electroencephalographic variables during surgical stimulation of horses anesthetized with isoflurane. Vet Surg. 1996;25:249–255. doi: 10.1111/j.1532-950x.1996.tb01409.x. [DOI] [PubMed] [Google Scholar]
- 30.Murrell JC, Johnson CB, White KL, Taylor PM, Haberham ZL, Waterman-Pearson AE. Changes in the EEG during castration in horses and ponies anaesthetized with halothane. Vet Anaesth Analg. 2003;30:138–146. doi: 10.1046/j.1467-2995.2003.00138.x. [DOI] [PubMed] [Google Scholar]
- 31.Murrell JC, Mitchinson SL, Waters D, Johnson CB. Comparative effect of thermal, mechanical, and electrical noxious stimuli on the electroencephalogram of the rat. Br J Anaesth. 2007;98:366–371. doi: 10.1093/bja/ael377. [DOI] [PubMed] [Google Scholar]
- 32.Gibson TJ, Johnson CB, Stafford KJ, Mitchinson SL, Mellor DJ. Validation of the acute electroencephalographic responses of calves to noxious stimulus with scoop dehorning. N Z Vet J. 2007;55:152–157. doi: 10.1080/00480169.2007.36760. [DOI] [PubMed] [Google Scholar]
- 33.Itamoto K, Taura Y, Wada N, Takuma T, Une S, Nakaichi M, Hikasa Y. Quantitative electroencephalography of medetomidine, medetomidine-midazolam and medetomidine-midazolam-butorphanol in dogs. J Vet Med A Physiol Pathol Clin Med. 2002;49:169–172. doi: 10.1046/j.1439-0442.2002.00425.x. [DOI] [PubMed] [Google Scholar]
- 34.Haga HA, Dolvik NI. Electroencephalographic and cardiovascular variables as nociceptive indicators in isoflurane-anaesthetized horses. Vet Anaesth Analg. 2005;32:128–135. doi: 10.1111/j.1467-2995.2005.00194.x. [DOI] [PubMed] [Google Scholar]


