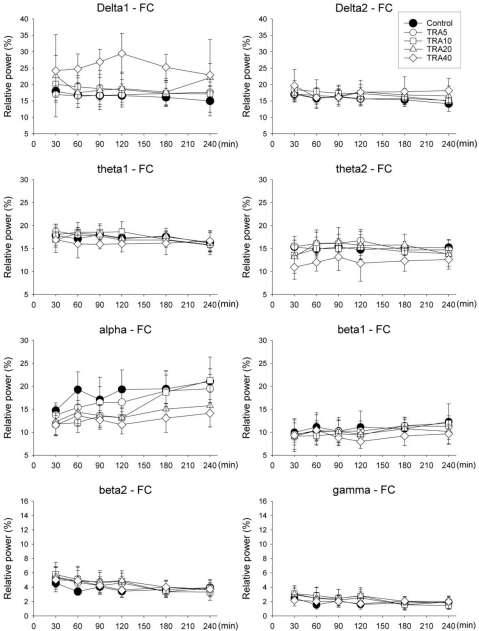
Fig. 3.
Relative band powers on the medial prefrontal cortex (FC) in rats treated with tramadol. The rats (n=6) were intraperitoneally administered saline, and tramadol 5, 10, 20 and 40 mg/kg, respectively (group 'Control', 'TRA5', 'TRA10', 'TRA20' and 'TRA40'). Data were expressed as mean±S.D. Data were analyzed by two factor repeated measures ANOVA with time and treatment, and a Bonferroni test was used to analyze variables for time between groups. Statistical results were not marked in figure, but were described in text.

