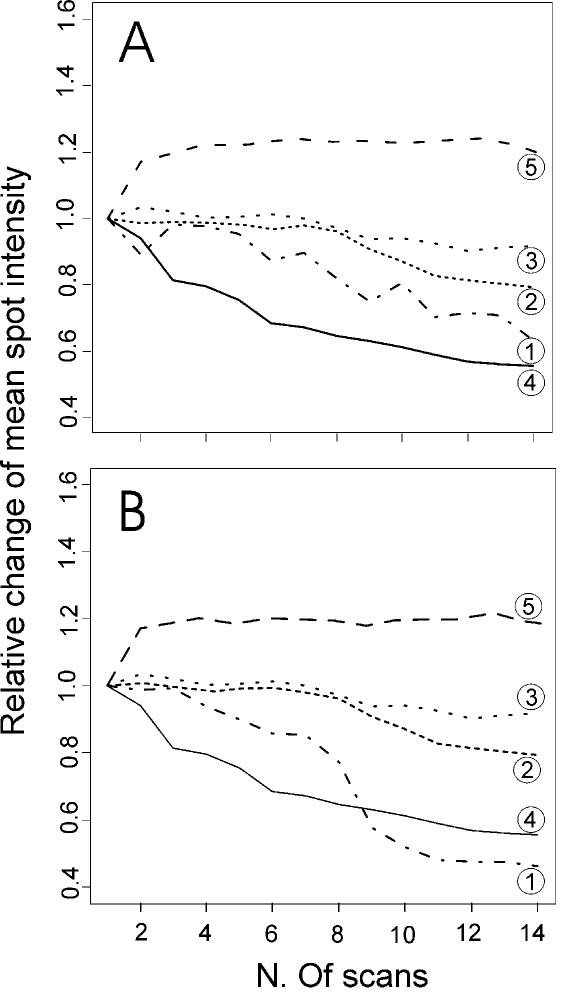
Figure 5.
Variation of spot signal with incremental scans of microarrays developed with different technologies. Microarrays processed with five different labelling and hybridisation protocols were subjected to 14 consecutive confocal laser scannings for Cy5 fluorescence. The averaged intensity values for groups of spots with intensity levels around 40 000 (A) and 500 (B), as revealed by QuantArray software, have been calculated for each scan and plotted. The protocols compared are: RT direct labelling of total RNA (1), direct labelling of aRNA (2); aminoallyl dye coupling (3); DNA dendrimer probes (4); and TSA technology (5). For each technology, a value of 1.0 was given to the mean intensity obtained after a single scan, and the intensities obtained after successive scans are reported in proportion to this reference value. From these experiments, it appears that six successive scans will give the maximum improvement of spot signal detection when microarrays are developed with technologies 2, 3 and 5, whereas for the others techniques (1 and 4) after four scans the performance begins to deteriorate and probably there would be no further benefit to the integrated image analysis.

