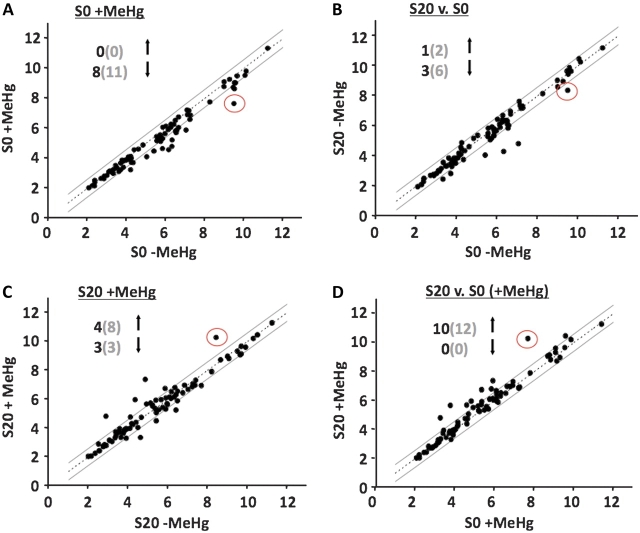
FIG. 8.
Overall changes in CYP transcripts. Scatter plots illustrating the pairwise comparisons of the CYP family probe set intensity data using the criteria of ≥ 1.5-fold change (boundary marked by solid lines) and a p value of ≤ 0.05. (Axes values are log2 of probe intensity.) (A) MeHg exposure to S0 strains leads to differential expression of eight transcripts with all being downregulated. (B) Basal expression in the S20 versus S0 strains shows a change in four transcripts and majority of them are downregulated. (C) MeHg exposure in S20 strains shows differential expression of seven transcripts with a majority being upregulated. (D) S20 versus S0 both with MeHg exposure shows differential expression of 10 transcripts with all being upregulated. CYP6g1 (red circle) is the most highly expressed and the strongest responder to selection + MeHg exposure. (Values in the parentheses are total number of CYP probes with ≥ 1.5-fold change irrespective of p value.).

