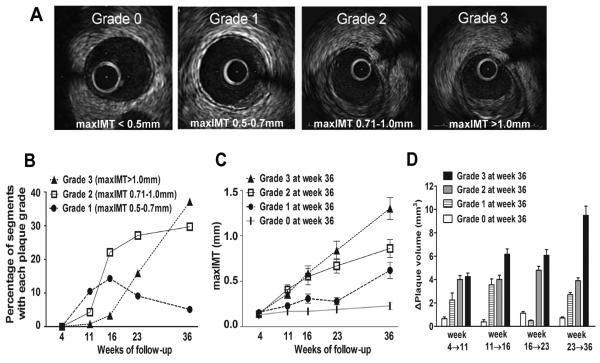
Figure 1.
A, Representative examples of each grade of plaque severity. Segments were categorized according to maxIMT by IVUS into 4 grades of plaque severity: grade 0 (<0.5mm), grade 1 (0.5-0.7mm), grade 2 (0.71-1.0mm) and grade 3 (>1.0mm). B, Evolution of plaque severity over time. C, Evolution of maxIMT at all preceding time points in segments which resulted in each grade of plaque severity at week 36. D, Change of plaque volume (ΔPV) during the four consecutive intervals of follow-up in segments culminating in each grade of plaque severity at week 36.

